Daily Capital Markets’ Performance
Discover today’s performance of BLOM indices, the closing prices of Lebanese stocks and Eurobonds, as well as the exchange rate of major currencies against the LBP.
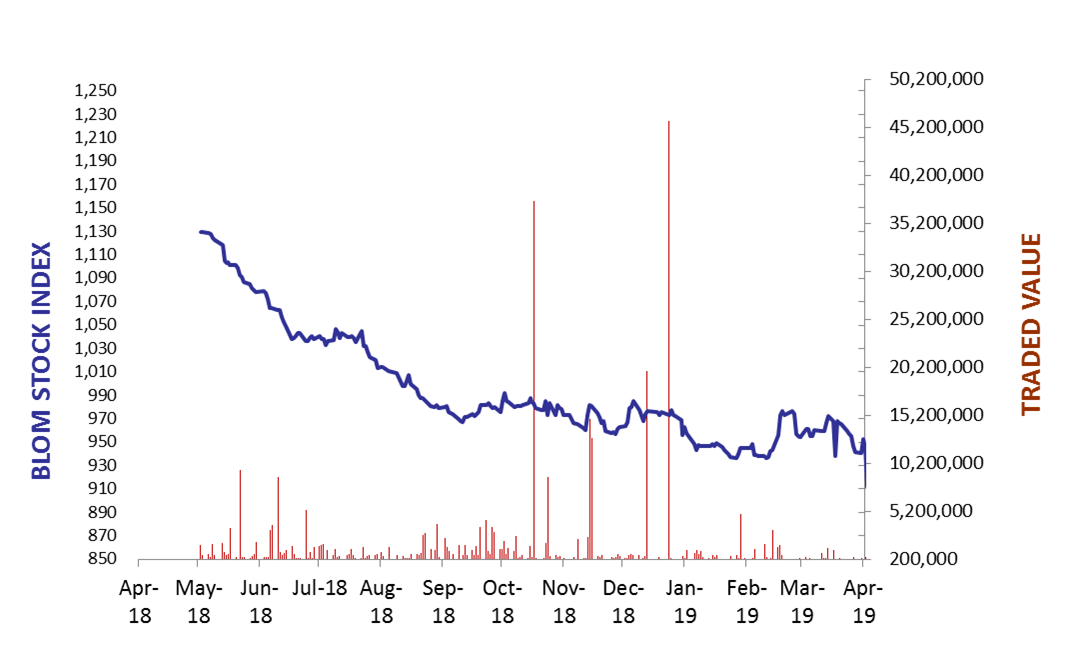
BLOM Stock Index (BSI) – today’s performance
| Last | Previous | % Change | Y-t-D Change | |
| BSI | 869.25 | 868.18 | 0.12% | -11.12% |
| High | 870.24 | 867.87 | ||
| Low | 867.43 | 870.13 | ` | |
| Volume | 105,716 | 6,716 | ||
| Val ($) | 568,161 | 34,516 |
I): BLOM preferred Shares Index (BPSI): today’s Performance
| Last | Previous | Change | |
| BPSI | 85.01 | 85.01 | 0.00% |
| Volume | – | – | |
| Value | – | – |
Lebanese Stocks: today’s Trades and Closing Prices
| Last Price ($) | % Change | Volume | VWAP ($) | |
| Solidere A | 5.2 | -2.07% | 94,458 | 5.2 |
| Solidere B | 5.35 | 3.28% | 4,758 | 5.35 |
| BLOM Bank GDR | 7.7 | 1.85% | 6,500 | 7.7 |
The BLOM Stock Index
Lebanese Global Depository Receipts: Last session’s Performance
| GDRs | Last Price ($) | Previous Price ($) | % Change | Volume | Value ($) |
| BLOM GDR | 7.7 | 7.65 | 0.65% | 9,015 | 69,360 |
| Audi GDR | 4.3 | 4.3 | 0.00% | – | – |
| Byblos GDR | 77 | 77 | 0.00% | – | – |
Closing Date: 23 May 2019
Source: London Stock Exchange
BLOM BOND INDEX: Last Session’s Performance
| Last | Previous | Change | Y-t-D Change | ||
| BBI | 89.29 | 90.01 | -0.79% | -11.64% | |
| Weighted Yield | 10.88% | 10.70% | 18 | bps | |
| Duration (Years) | 5.19 | 5.21 | |||
| 5Y Bond Yield | 11.41% | 11.20% | 21 | bps | |
| 5Y Spread* | 933 | 903 | 30 | bps | |
| 10Y Bond Yield | 10.80% | 10.68% | 12 | bps | |
| 10Y Spread* | 860 | 840 | 20 | bps | |
*between Lebanese Eurobonds and US Treasuries
Closing Date: 23 May 2019
Lebanese Eurobonds: Last Sessions’ Prices and Yields
| Price | Yield | Yield Change | |
| 12/04/2021 | 95.31 | 11.06% | 19 |
| 04/10/2022 | 85.48 | 11.41% | 27 |
| 27/01/2023 | 83.80 | 11.52% | 26 |
| 22/04/2024 | 82.05 | 11.53% | 23 |
| 04/11/2024 | 80.07 | 11.24% | 21 |
| 03/12/2024 | 82.29 | 11.41% | 14 |
| 26/02/2025 | 79.75 | 11.04% | 18 |
| 12/06/2025 | 80.54 | 10.70% | 17 |
| 28/11/2026 | 78.98 | 10.75% | 16 |
| 23/03/2027 | 79.00 | 10.90% | 15 |
| 29/11/2027 | 77.85 | 10.79% | 16 |
| 03/11/2028 | 77.36 | 10.48% | 15 |
| 26/02/2030 | 75.01 | 10.60% | 16 |
| 22/04/2031 | 75.54 | 10.67% | 10 |
| 23/03/2032 | 78.08 | 10.08% | 13 |
| 02/11/2035 | 75.21 | 10.19% | 10 |
| 23/03/2037 | 75.83 | 10.22% | 11 |
Lebanese Forex Market
| Last Price | Previous | % Change | Y-t-D | |
| $/LBP | 1,514.25 | 1,514.25 | – | |
| €/LBP | 1,687.34 | 1,681.31 | 0.36% | |
| £/LBP | 1,908.50 | 1,908.65 | -0.01% | |
| NEER | 119.64 | 120.05 | -0.34% |
Closing Date: 24 May 2019