Discover today’s performance of BLOM indices, the closing prices of Lebanese stocks and Eurobonds, as well as the exchange rate of major currencies against the LBP.
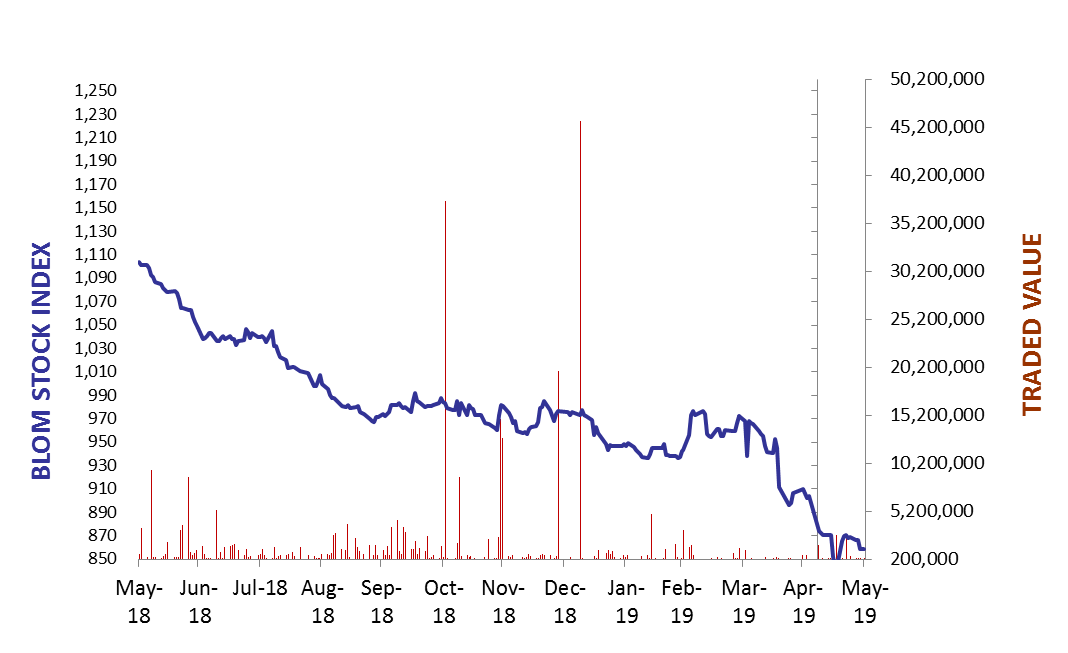
BLOM Stock Index (BSI) – today’s performance
| |
Last |
Previous |
% Change |
Y-t-D Change |
| BSI |
858.31 |
858.56 |
-0.03% |
-12.10% |
| High |
858.75 |
858.00 |
|
|
| Low |
856.20 |
854.70 |
|
` |
| Volume |
24,513 |
12,134 |
|
|
| Val ($) |
264,150 |
182,160 |
|
|
I): BLOM preferred Shares Index (BPSI): today’s Performance
| |
Last |
Previous |
Change |
| BPSI |
84.86 |
84.86 |
0.00% |
| Volume |
1,000 |
1,450 |
|
| Value |
93,000 |
131,250 |
|
Lebanese Stocks: today’s Trades and Closing Prices
| |
Last Price ($) |
% Change |
Volume |
VWAP ($) |
| Solidere A |
5.11 |
-1.35% |
398 |
5.11 |
| Solidere B |
5.08 |
1.40% |
4,145 |
5.08 |
| BEMO – Pref 2013 |
93 |
0.00% |
1,000 |
93 |
| BLOM GDR |
7.7 |
0.00% |
18,669 |
7.7 |
| HOLCIM |
14.3 |
0.00% |
301 |
14.3 |
The BLOM Stock Index
Lebanese Global Depository Receipts: Last session’s Performance
| GDRs |
Last Price ($) |
Previous Price ($) |
% Change |
Volume |
Value ($) |
| BLOM GDR |
7.8 |
7.85 |
-0.64% |
2,400 |
18,720 |
| Audi GDR |
4 |
4 |
0.00% |
4,700 |
18,772 |
| Byblos GDR |
77 |
77 |
0.00% |
– |
– |
Closing Date: 30 May 2019
Source: London Stock Exchange
BLOM BOND INDEX: Last Session’s Performance
| |
Last |
Previous |
Change |
Y-t-D Change |
| BBI |
88.78 |
88.95 |
-0.19% |
|
-12.15% |
| Weighted Yield |
11.01% |
10.97% |
4 |
bps |
|
| Duration (Years) |
5.20 |
5.21 |
|
|
|
| 5Y Bond Yield |
11.53% |
11.52% |
1 |
bps |
|
| 5Y Spread* |
953 |
948 |
5 |
bps |
|
| 10Y Bond Yield |
10.92% |
10.90% |
2 |
bps |
|
| 10Y Spread* |
880 |
874 |
6 |
bps |
|
*between Lebanese Eurobonds and US Treasuries
Closing Date: 30 May 2019
Lebanese Eurobonds: Last Sessions’ Prices and Yields
|
Price |
Yield |
Yield Change |
| 12/04/2021 |
95.06 |
11.25% |
5 |
| 04/10/2022 |
85.33 |
11.50% |
6 |
| 27/01/2023 |
83.57 |
11.64% |
3 |
| 22/04/2024 |
81.72 |
11.65% |
3 |
| 04/11/2024 |
79.71 |
11.36% |
5 |
| 03/12/2024 |
82.01 |
11.50% |
12 |
| 26/02/2025 |
79.25 |
11.19% |
4 |
| 12/06/2025 |
79.83 |
10.90% |
5 |
| 28/11/2026 |
78.36 |
10.90% |
6 |
| 23/03/2027 |
78.42 |
11.04% |
4 |
| 29/11/2027 |
77.21 |
10.94% |
4 |
| 03/11/2028 |
76.93 |
10.57% |
4 |
| 26/02/2030 |
74.30 |
10.74% |
3 |
| 22/04/2031 |
74.99 |
10.78% |
4 |
| 23/03/2032 |
77.68 |
10.15% |
2 |
| 02/11/2035 |
74.29 |
10.33% |
6 |
| 23/03/2037 |
75.27 |
10.31% |
1 |
Lebanese Forex Market
| |
Last Price |
Previous |
% Change |
Y-t-D |
| $/LBP |
1,514.25 |
1,514.25 |
– |
|
| €/LBP |
1,683.27 |
1,678.00 |
0.31% |
|
| £/LBP |
1,901.56 |
1,900.66 |
0.05% |
|
| NEER |
119.43 |
119.60 |
-0.14% |
|
Closing Date: 31 May 2019