Discover today’s performance of BLOM indices, the closing prices of Lebanese stocks and Eurobonds, as well as the exchange rate of major currencies against the LBP.
BLOM Stock Index (BSI) – today’s performance
| |
Last |
Previous |
% Change |
Y-t-D Change |
| BSI |
852.82 |
847.25 |
0.66% |
-13.26% |
| High |
852.82 |
847.30 |
|
|
| Low |
841.12 |
814.20 |
|
` |
| Volume |
15,741 |
32,450 |
|
|
| Val ($) |
100,186 |
174,375 |
|
|
I): BLOM preferred Shares Index (BPSI): today’s Performance
| |
Last |
Previous |
Change |
| BPSI |
84.87 |
84.87 |
0.00% |
| Volume |
– |
– |
|
| Value |
– |
– |
|
Lebanese Stocks: today’s Trades and Closing Prices
| |
Last Price ($) |
% Change |
Volume |
VWAP ($) |
| Solidere A |
5.89 |
7.28% |
10,691 |
5.98 |
| Solidere B |
5.83 |
8.56% |
4,050 |
5.9 |
| HOLCIM |
13.5 |
-5.59% |
1,000 |
13.5 |
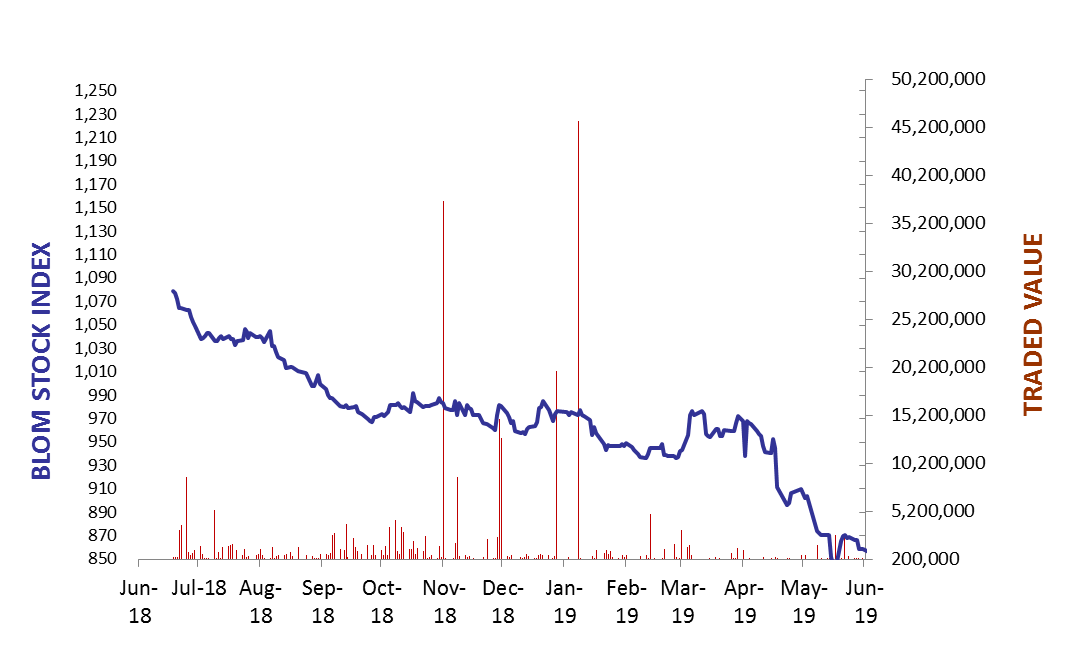
The BLOM Stock Index
Lebanese Global Depository Receipts: Last session’s Performance
| GDRs |
Last Price ($) |
Previous Price ($) |
% Change |
Volume |
Value ($) |
| BLOM GDR |
7.55 |
7.55 |
0.00% |
236 |
1,782 |
| Audi GDR |
3.98 |
3.9 |
2.05% |
400 |
1,592 |
| Byblos GDR |
77 |
77 |
0.00% |
– |
– |
Closing Date: 14 June 2019
Source: London Stock Exchange
BLOM BOND INDEX: Last Session’s Performance
| |
Last |
Previous |
Change |
Y-t-D Change |
| BBI |
86.74 |
87.46 |
-0.82% |
|
-14.17% |
| Weighted Yield |
11.57% |
11.40% |
17 |
bps |
|
| Duration (Years) |
5.14 |
5.16 |
|
|
|
| 5Y Bond Yield |
12.25% |
12.02% |
23 |
bps |
|
| 5Y Spread* |
1046 |
1024 |
22 |
bps |
|
| 10Y Bond Yield |
11.55% |
11.31% |
24 |
bps |
|
| 10Y Spread* |
959 |
935 |
24 |
bps |
|
*between Lebanese Eurobonds and US Treasuries
Closing Date: 14 June 2019
Lebanese Eurobonds: Last Sessions’ Prices and Yields
|
Price |
Yield |
Yield Change |
| 12/04/2021 |
93.73 |
12.16% |
11 |
| 04/10/2022 |
83.83 |
12.18% |
22 |
| 27/01/2023 |
82.08 |
12.27% |
21 |
| 22/04/2024 |
80.29 |
12.13% |
16 |
| 04/11/2024 |
78.29 |
11.80% |
16 |
| 03/12/2024 |
80.27 |
12.02% |
22 |
| 26/02/2025 |
77.54 |
11.70% |
18 |
| 12/06/2025 |
78.04 |
11.41% |
20 |
| 28/11/2026 |
76.00 |
11.47% |
25 |
| 23/03/2027 |
75.96 |
11.63% |
21 |
| 29/11/2027 |
74.71 |
11.51% |
20 |
| 03/11/2028 |
74.67 |
11.05% |
14 |
| 26/02/2030 |
72.75 |
11.05% |
12 |
| 22/04/2031 |
73.01 |
11.16% |
16 |
| 23/03/2032 |
75.21 |
10.58% |
13 |
| 02/11/2035 |
72.58 |
10.61% |
12 |
| 23/03/2037 |
73.00 |
10.67% |
14 |
Lebanese Forex Market
| |
Last Price |
Previous |
% Change |
Y-t-D |
| $/LBP |
1,514.25 |
1,514.25 |
– |
|
| €/LBP |
1,692.47 |
1,689.46 |
0.18% |
|
| £/LBP |
1,893.12 |
1,897.94 |
-0.25% |
|
| NEER |
*119.01 |
119.01 |
– |
|
Closing Date: 17 June 2019
*N/A: will be reflected/updated as “previous value” on June 18, 2019