Discover today’s performance of BLOM indices, the closing prices of Lebanese stocks and Eurobonds, as well as the exchange rate of major currencies against the LBP.
BLOM Stock Index (BSI) – today’s performance
| |
Last |
Previous |
% Change |
Y-t-D Change |
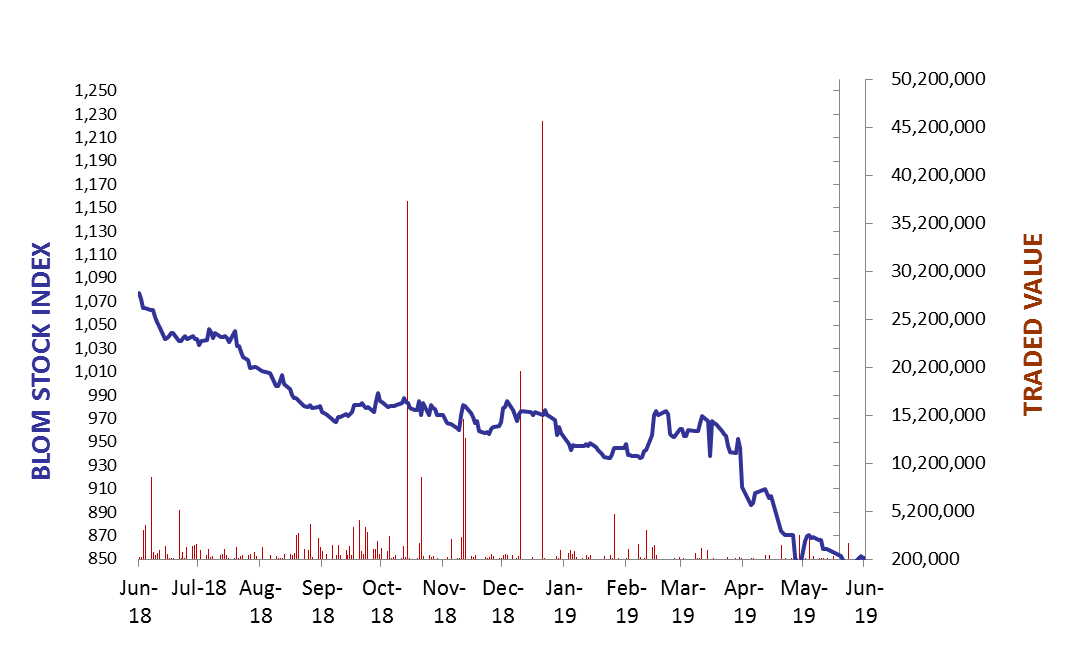
| BSI |
846.87 |
850.79 |
-0.46% |
-12.90% |
| High |
851.40 |
853.40 |
|
|
| Low |
845.40 |
847.10 |
|
` |
| Volume |
342,147 |
45,841 |
|
|
| Val ($) |
495,904 |
237,416 |
|
|
I): BLOM preferred Shares Index (BPSI): today’s Performance
| |
Last |
Previous |
Change |
| BPSI |
84.87 |
84.87 |
0.00% |
| Volume |
– |
– |
|
| Value |
– |
– |
|
Lebanese Stocks: today’s Trades and Closing Prices
| |
Last Price ($) |
% Change |
Volume |
VWAP ($) |
| Solidere A |
5.54 |
-5.94% |
12,698 |
5.73 |
| Solidere B |
5.58 |
-2.28% |
2,920 |
5.66 |
| Byblos Bank Listed |
1.22 |
0.83% |
320,782 |
1.22 |
| CB (N) |
2.66 |
-1.48% |
5,747 |
2.66 |
The BLOM Stock Index
Lebanese Global Depository Receipts: Last session’s Performance
| GDRs |
Last Price ($) |
Previous Price ($) |
% Change |
Volume |
Value ($) |
| BLOM GDR |
7.55 |
7.55 |
0.00% |
300 |
2,265 |
| Audi GDR |
3.98 |
3.98 |
0.00% |
500 |
1,990 |
| Byblos GDR |
77 |
77 |
0.00% |
– |
– |
Closing Date: 18 June 2019
Source: London Stock Exchange
BLOM BOND INDEX: Last Session’s Performance
| |
Last |
Previous |
Change |
Y-t-D Change |
| BBI |
86.80 |
86.14 |
0.77% |
|
-14.11% |
| Weighted Yield |
11.60% |
11.77% |
-16 |
bps |
|
| Duration (Years) |
5.13 |
5.12 |
|
|
|
| 5Y Bond Yield |
12.25% |
12.42% |
-17 |
bps |
|
| 5Y Spread* |
1045 |
1062 |
-17 |
bps |
|
| 10Y Bond Yield |
11.48% |
11.65% |
-17 |
bps |
|
| 10Y Spread* |
955 |
969 |
-14 |
bps |
|
*between Lebanese Eurobonds and US Treasuries
Closing Date: 18 June 2019
Lebanese Eurobonds: Last Sessions’ Prices and Yields
|
Price |
Yield |
Yield Change |
| 12/04/2021 |
93.21 |
12.53% |
-19 |
| 04/10/2022 |
83.79 |
12.21% |
-15 |
| 27/01/2023 |
81.96 |
12.34% |
-19 |
| 22/04/2024 |
80.42 |
12.10% |
-13 |
| 04/11/2024 |
78.42 |
11.78% |
-16 |
| 03/12/2024 |
80.50 |
11.97% |
-14 |
| 26/02/2025 |
77.63 |
11.69% |
-15 |
| 12/06/2025 |
78.13 |
11.39% |
-15 |
| 28/11/2026 |
76.17 |
11.44% |
-18 |
| 23/03/2027 |
76.13 |
11.59% |
-18 |
| 29/11/2027 |
74.92 |
11.46% |
-17 |
| 03/11/2028 |
74.83 |
11.02% |
-16 |
| 26/02/2030 |
73.13 |
10.98% |
-19 |
| 22/04/2031 |
73.24 |
11.11% |
-12 |
| 23/03/2032 |
75.25 |
10.57% |
-12 |
| 02/11/2035 |
72.83 |
10.57% |
-12 |
| 23/03/2037 |
73.29 |
10.62% |
-13 |
Lebanese Forex Market
| |
Last Price |
Previous |
% Change |
Y-t-D |
| $/LBP |
1,514.25 |
1,514.25 |
– |
|
| €/LBP |
1,688.55 |
1,687.50 |
0.06% |
|
| £/LBP |
1,896.28 |
1,893.27 |
0.16% |
|
| NEER |
119.05 |
119.17 |
-0.10% |
|
Closing Date: 19 June 2019