Discover today’s performance of BLOM indices, the closing prices of Lebanese stocks and Eurobonds, as well as the exchange rate of major currencies against the LBP.
BLOM Stock Index (BSI) – today’s performance
| |
Last |
Previous |
% Change |
Y-t-D Change |
| BSI |
858.26 |
854.50 |
0.44% |
-12.52% |
| High |
858.60 |
854.50 |
|
|
| Low |
845.30 |
843.00 |
|
` |
| Volume |
131,020 |
97,729 |
|
|
| Val ($) |
459,874 |
343,653 |
|
|
I): BLOM preferred Shares Index (BPSI): today’s Performance
| |
Last |
Previous |
Change |
| BPSI |
83.70 |
83.70 |
0.00% |
| Volume |
– |
450 |
|
| Value |
– |
33,750 |
|
Lebanese Stocks: today’s Trades and Closing Prices
| |
Last Price ($) |
% Change |
Volume |
VWAP ($) |
| Solidere A |
6.37 |
3.75% |
36,676 |
6.37 |
| Solidere B |
6.22 |
3.49% |
24,782 |
6.22 |
| BLC Bank – Listed |
0.93 |
0.00% |
1,407 |
0.93 |
| Byblos Bank – Listed |
1.23 |
0.00% |
68,155 |
1.23 |
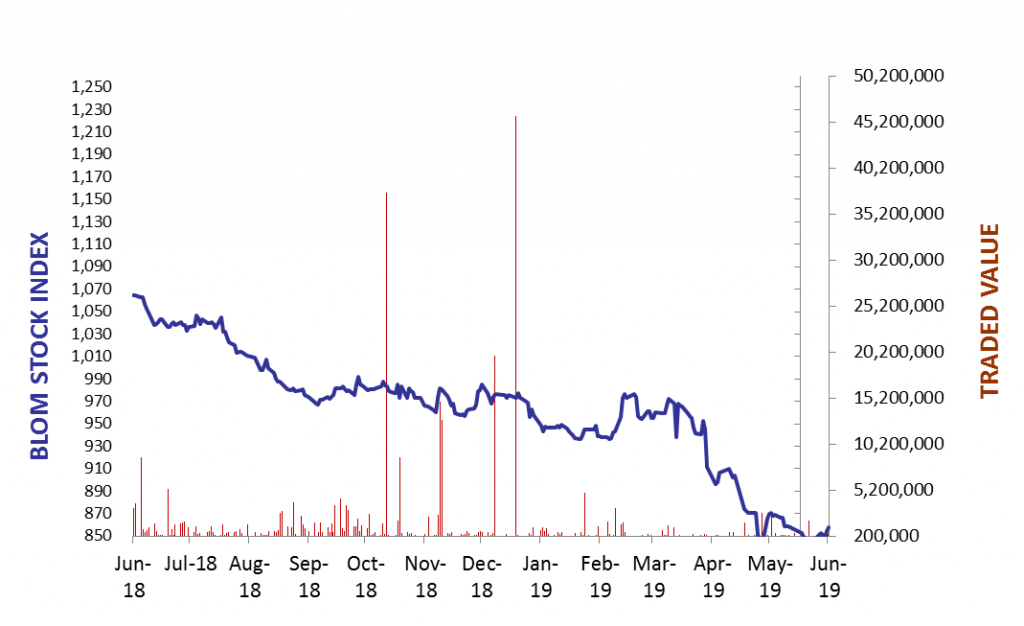
The BLOM Stock Index
Lebanese Global Depository Receipts: Last session’s Performance
| GDRs |
Last Price ($) |
Previous Price ($) |
% Change |
Volume |
Value ($) |
| BLOM GDR |
7.55 |
7.05 |
7.09% |
11,976 |
90,397 |
| Audi GDR |
3.98 |
3.98 |
0.00% |
– |
– |
| Byblos GDR |
77 |
77 |
0.00% |
– |
– |
Closing Date: 20 June 2019
Source: London Stock Exchange
BLOM BOND INDEX: Last Session’s Performance
| |
Last |
Previous |
Change |
Y-t-D Change |
| BBI |
89.45 |
87.50 |
2.22% |
|
-11.49% |
| Weighted Yield |
10.97% |
11.43% |
-46 |
bps |
|
| Duration (Years) |
5.18 |
5.14 |
|
|
|
| 5Y Bond Yield |
11.50% |
12.15% |
-65 |
bps |
|
| 5Y Spread* |
981 |
1045 |
-64 |
bps |
|
| 10Y Bond Yield |
10.85% |
11.30% |
-45 |
bps |
|
| 10Y Spread* |
898 |
941 |
-43 |
bps |
|
*between Lebanese Eurobonds and US Treasuries
Closing Date: 20 June 2019
Lebanese Eurobonds: Last Sessions’ Prices and Yields
|
Price |
Yield |
Yield Change |
| 12/04/2021 |
94.25 |
11.85% |
-46 |
| 04/10/2022 |
85.67 |
11.44% |
-53 |
| 27/01/2023 |
83.96 |
11.57% |
-58 |
| 22/04/2024 |
82.38 |
11.49% |
-47 |
| 04/11/2024 |
80.25 |
11.24% |
-41 |
| 03/12/2024 |
82.25 |
11.47% |
-36 |
| 26/02/2025 |
79.75 |
11.09% |
-43 |
| 12/06/2025 |
80.25 |
10.82% |
-43 |
| 28/11/2026 |
78.83 |
10.81% |
-45 |
| 23/03/2027 |
78.96 |
10.94% |
-47 |
| 29/11/2027 |
77.83 |
10.82% |
-48 |
| 03/11/2028 |
77.75 |
10.42% |
-47 |
| 26/02/2030 |
76.67 |
10.30% |
-52 |
| 22/04/2031 |
76.15 |
10.58% |
-37 |
| 23/03/2032 |
78.33 |
10.05% |
-37 |
| 02/11/2035 |
76.13 |
10.05% |
-39 |
| 23/03/2037 |
76.79 |
10.08% |
-39 |
Lebanese Forex Market
| |
Last Price |
Previous |
% Change |
Y-t-D |
| $/LBP |
1,514.25 |
1,514.25 |
– |
|
| €/LBP |
1,705.74 |
1,702.42 |
0.19% |
|
| £/LBP |
1,908.19 |
1,914.83 |
-0.35% |
|
| NEER |
118.27 |
118.10 |
0.15% |
|
Closing Date: 21 June 2019