Discover today’s performance of BLOM indices, the closing prices of Lebanese stocks and Eurobonds, as well as the exchange rate of major currencies against the LBP.
BLOM Stock Index (BSI) – today’s performance
| |
Last |
Previous |
% Change |
Y-t-D Change |
| BSI |
846.00 |
838.62 |
0.88% |
-13.39% |
| High |
846.00 |
840.90 |
|
|
| Low |
838.50 |
837.70 |
|
` |
| Volume |
48,653 |
59,505 |
|
|
| Val ($) |
329,476 |
363,852 |
|
|
I): BLOM preferred Shares Index (BPSI): today’s Performance
| |
Last |
Previous |
Change |
| BPSI |
82.54 |
82.54 |
0.00% |
| Volume |
653 |
100 |
|
| Value |
47,669 |
7,300 |
|
Lebanese Stocks: today’s Trades and Closing Prices
| |
Last Price ($) |
% Change |
Volume |
VWAP ($) |
| Solidere A |
6.43 |
6.99% |
35,000 |
6.43 |
| Solidere B |
6.46 |
7.67% |
10,000 |
6.46 |
| Bank Audi Pref H |
73 |
0.00% |
653 |
73.00 |
| Byblos Listed |
1.2 |
0.00% |
3,000 |
1.20 |
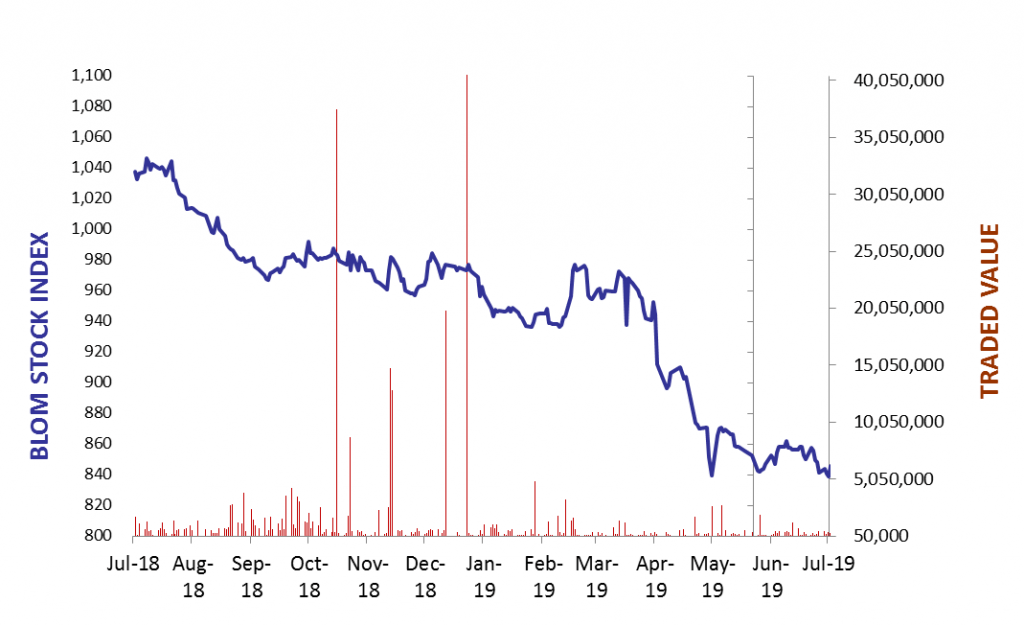
The BLOM Stock Index
Lebanese Global Depository Receipts: Last session’s Performance
| GDRs |
Last Price ($) |
Previous Price ($) |
% Change |
Volume |
Value ($) |
| BLOM GDR |
7.45 |
7.4 |
0.68% |
20,002 |
148,015 |
| Audi GDR |
3.96 |
3.96 |
0.00% |
– |
– |
| Byblos GDR |
77 |
77 |
0.00% |
– |
– |
Closing Date: 17 July 2019
Source: London Stock Exchange
BLOM BOND INDEX: Last Session’s Performance
| |
Last |
Previous |
Change |
Y-t-D Change |
| BBI |
89.72 |
89.67 |
0.06% |
|
-11.22% |
| Weighted Yield |
10.97% |
10.98% |
-2 |
bps |
|
| Duration (Years) |
5.10 |
5.11 |
|
|
|
| 5Y Bond Yield |
11.50% |
11.57% |
-7 |
bps |
|
| 5Y Spread* |
970 |
973 |
-3 |
bps |
|
| 10Y Bond Yield |
10.73% |
10.73% |
0 |
bps |
|
| 10Y Spread* |
879 |
873 |
6 |
bps |
|
*between Lebanese Eurobonds and US Treasuries
Closing Date: 17 July 2019
Lebanese Eurobonds: Last Sessions’ Prices and Yields
|
Price |
Yield |
Yield Change |
| 12/04/2021 |
94.13 |
12.08% |
-5 |
| 04/10/2022 |
86.04 |
11.40% |
-5 |
| 27/01/2023 |
84.21 |
11.58% |
0 |
| 22/04/2024 |
82.32 |
11.58% |
-6 |
| 04/11/2024 |
79.98 |
11.38% |
0 |
| 03/12/2024 |
82.10 |
11.56% |
2 |
| 26/02/2025 |
80.00 |
11.08% |
0 |
| 12/06/2025 |
80.65 |
10.76% |
0 |
| 28/11/2026 |
79.04 |
10.79% |
0 |
| 23/03/2027 |
79.42 |
10.86% |
0 |
| 29/11/2027 |
78.38 |
10.73% |
0 |
| 03/11/2028 |
78.63 |
10.27% |
0 |
| 26/02/2030 |
76.88 |
10.28% |
0 |
| 22/04/2031 |
77.51 |
10.35% |
0 |
| 23/03/2032 |
78.33 |
10.06% |
-3 |
| 02/11/2035 |
76.47 |
10.00% |
-2 |
| 23/03/2037 |
77.17 |
10.04% |
0 |
Lebanese Forex Market
| |
Last Price |
Previous |
% Change |
Y-t-D |
| $/LBP |
1,514.25 |
1,514.25 |
– |
|
| €/LBP |
1,691.42 |
1,692.32 |
-0.05% |
|
| £/LBP |
1,882.57 |
1,874.43 |
0.43% |
|
| NEER |
118.43 |
118.47 |
-0.03% |
|
Closing Date: 18 July 2019