Discover today’s performance of BLOM indices, the closing prices of Lebanese stocks and Eurobonds, as well as the exchange rate of major currencies against the LBP.
BLOM Stock Index (BSI) – today’s performance
| |
Last |
Previous |
% Change |
Y-t-D Change |
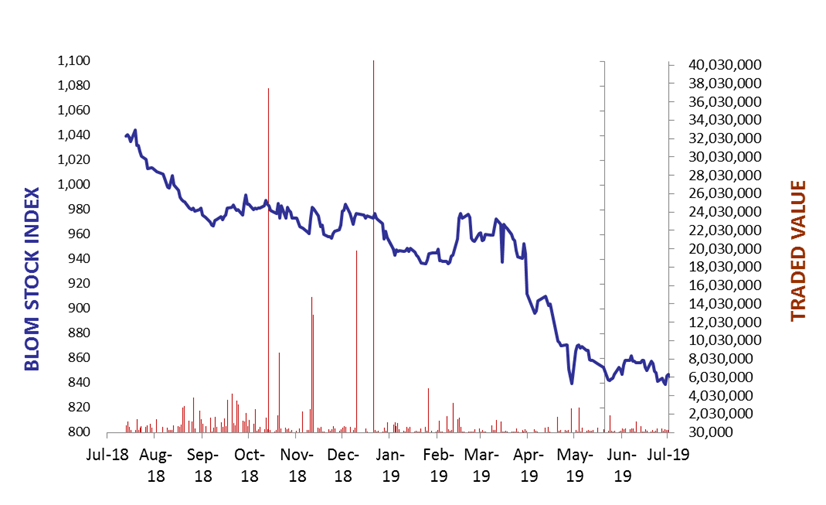
| BSI |
828.47 |
828.86 |
-0.05% |
-15.19% |
| High |
831.30 |
832.00 |
|
|
| Low |
826.70 |
820.23 |
|
` |
| Volume |
120,907 |
574,170 |
|
|
| Val ($) |
646,186 |
2,274,564 |
|
|
I): BLOM preferred Shares Index (BPSI): today’s Performance
| |
Last |
Previous |
Change |
| BPSI |
82.43 |
82.43 |
0.00% |
| Volume |
|
|
|
| Value |
|
|
|
Lebanese Stocks: today’s Trades and Closing Prices
| |
Last Price ($) |
% Change |
Volume |
VWAP ($) |
| Solidere A |
6.5 |
1.56% |
67,608 |
6.5 |
| Solidere B |
6.74 |
4.50% |
24,385 |
6.74 |
| Bank Audi GDR |
3.75 |
0.00% |
4,140 |
3.75 |
| Byblos Bank – Listed |
1.19 |
-0.83% |
24,074 |
1.19 |
| HOLCIM |
10.12 |
-12.00% |
700 |
10.12 |
The BLOM Stock Index
Lebanese Global Depository Receipts: Last session’s Performance
| GDRs |
Last Price ($) |
Previous Price ($) |
% Change |
Volume |
Value ($) |
| BLOM GDR |
7.15 |
7.1 |
0.70% |
6,988 |
50,714 |
| Audi GDR |
3.96 |
3.86 |
2.59% |
7,450 |
29,502 |
| Byblos GDR |
77 |
77 |
0.00% |
– |
– |
Closing Date: 30 July 2019
Source: London Stock Exchange
BLOM BOND INDEX: Last Session’s Performance
| |
Last |
Previous |
Change |
Y-t-D Change |
| BBI |
87.50 |
88.04 |
-0.61% |
|
-13.41% |
| Weighted Yield |
11.39% |
11.25% |
15 |
bps |
|
| Duration (Years) |
5.05 |
5.06 |
|
|
|
| 5Y Bond Yield |
12.11% |
11.98% |
13 |
bps |
|
| 5Y Spread* |
1029 |
1017 |
12 |
bps |
|
| 10Y Bond Yield |
11.10% |
10.97% |
13 |
bps |
|
| 10Y Spread* |
917 |
904 |
13 |
bps |
|
*between Lebanese Eurobonds and US Treasuries
Closing Date: 30 July 2019
Lebanese Eurobonds: Last Sessions’ Prices and Yields
|
Price |
Yield |
Yield Change |
| 12/04/2021 |
93.33 |
12.71% |
22 |
| 04/10/2022 |
84.50 |
12.11% |
24 |
| 27/01/2023 |
82.92 |
12.15% |
17 |
| 22/04/2024 |
81.33 |
11.92% |
12 |
| 04/11/2024 |
78.88 |
11.74% |
14 |
| 03/12/2024 |
80.88 |
11.94% |
15 |
| 26/02/2025 |
78.71 |
11.47% |
15 |
| 12/06/2025 |
79.05 |
11.22% |
19 |
| 28/11/2026 |
77.46 |
11.18% |
16 |
| 23/03/2027 |
77.83 |
11.24% |
11 |
| 29/11/2027 |
76.83 |
11.08% |
10 |
| 03/11/2028 |
76.92 |
10.62% |
9 |
| 26/02/2030 |
75.21 |
10.60% |
14 |
| 22/04/2031 |
76.06 |
10.61% |
8 |
| 23/03/2032 |
77.17 |
10.26% |
6 |
| 02/11/2035 |
75.17 |
10.21% |
7 |
| 23/03/2037 |
75.91 |
10.22% |
7 |
Lebanese Forex Market
| |
Last Price |
Previous |
% Change |
Y-t-D |
| $/LBP |
1,514.25 |
1,514.25 |
– |
|
| €/LBP |
1,679.96 |
1,682.07 |
-0.13% |
|
| £/LBP |
1,834.48 |
1,831.76 |
0.15% |
|
| NEER |
118.43 |
118.54 |
-0.09% |
|
Closing Date: 31 July 2019


