Discover today’s performance of BLOM indices, the closing prices of Lebanese stocks and Eurobonds, as well as the exchange rate of major currencies against the LBP.
BLOM Stock Index (BSI) – today’s performance
| |
Last |
Previous |
% Change |
Y-t-D Change |
| BSI |
804.47 |
808.48 |
-0.50% |
-17.64% |
| High |
808.50 |
808.50 |
|
|
| Low |
804.50 |
806.90 |
|
` |
| Volume |
62,344 |
35,369 |
|
|
| Val ($) |
388,483 |
221,521 |
|
|
I): BLOM preferred Shares Index (BPSI): today’s Performance
| |
Last |
Previous |
Change |
| BPSI |
82.02 |
82.02 |
0.00% |
| Volume |
– |
– |
|
| Value |
– |
– |
|
Lebanese Stocks: today’s Trades and Closing Prices
| |
Last Price ($) |
% Change |
Volume |
VWAP ($) |
| Solidere A |
5.96 |
-1.97% |
8,190 |
5.96 |
| Solidere B |
5.98 |
-1.48% |
216 |
5.98 |
| Bank Audi |
3.74 |
-1.32% |
700 |
3.74 |
| Bank Audi GDR |
3.69 |
-0.27% |
12,336 |
3.69 |
| BLOM GDR |
7.1 |
0.00% |
40,902 |
7.10 |
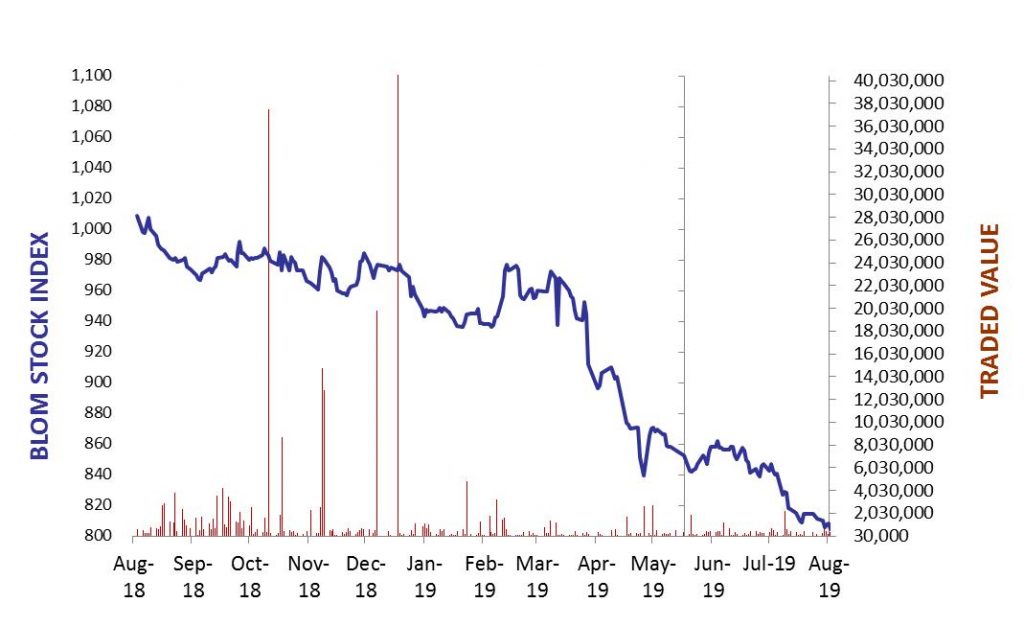
The BLOM Stock Index
Lebanese Global Depository Receipts: Last session’s Performance
| GDRs |
Last Price ($) |
Previous Price ($) |
% Change |
Volume |
Value ($) |
| BLOM GDR |
7.00 |
7 |
0.00% |
2,167 |
15,169 |
| Audi GDR |
3.7 |
3.7 |
0.00% |
50 |
185 |
| Byblos GDR |
77 |
77 |
0.00% |
– |
– |
Closing Date: 22 Aug. 2019
Source: London Stock Exchange
BLOM BOND INDEX: Last Session’s Performance
| |
Last |
Previous |
Change |
Y-t-D Change |
| BBI |
78.47 |
78.53 |
-0.07% |
|
-22.35% |
| Weighted Yield |
14.26% |
14.24% |
2 |
bps |
|
| Duration (Years) |
4.84 |
4.85 |
|
|
|
| 5Y Bond Yield |
15.86% |
15.82% |
4 |
bps |
|
| 5Y Spread* |
1,433 |
1,432 |
1 |
bps |
|
| 10Y Bond Yield |
13.25% |
13.14% |
11 |
bps |
|
| 10Y Spread* |
1169 |
1,160 |
9 |
bps |
|
*between Lebanese Eurobonds and US Treasuries
Closing Date: 22 Aug 2019
Lebanese Eurobonds: Last Sessions’ Prices and Yields
|
Price |
Yield |
Yield Change |
| 12/04/2021 |
86.13 |
18.41% |
-5 |
| 04/10/2022 |
76.45 |
15.98% |
16 |
| 27/01/2023 |
74.65 |
15.86% |
2 |
| 22/04/2024 |
72.47 |
15.07% |
3 |
| 04/11/2024 |
69.89 |
14.73% |
13 |
| 03/12/2024 |
72.58 |
14.62% |
-2 |
| 26/02/2025 |
70.49 |
14.07% |
-2 |
| 12/06/2025 |
71.00 |
13.63% |
-5 |
| 28/11/2026 |
68.74 |
13.47% |
1 |
| 23/03/2027 |
68.83 |
13.55% |
3 |
| 29/11/2027 |
68.08 |
13.20% |
7 |
| 03/11/2028 |
68.06 |
12.61% |
-1 |
| 26/02/2030 |
67.22 |
12.29% |
5 |
| 22/04/2031 |
67.28 |
12.37% |
4 |
| 23/03/2032 |
67.72 |
12.04% |
0 |
| 02/11/2035 |
67.74 |
11.48% |
-2 |
| 23/03/2037 |
67.86 |
11.56% |
-3 |
Lebanese Forex Market
| |
Last Price |
Previous |
% Change |
Y-t-D |
| $/LBP |
1,514.25 |
1,514.25 |
– |
|
| €/LBP |
1,668.20 |
1,670.01 |
-0.11% |
|
| £/LBP |
1,844.28 |
1,846.69 |
-0.13% |
|
| NEER |
119.96 |
119.98 |
-0.02% |
|
Closing Date: 23 Aug. 2019