Discover today’s performance of BLOM indices, the closing prices of Lebanese stocks and Eurobonds, as well as the exchange rate of major currencies against the LBP.
BLOM Stock Index (BSI) – today’s performance
| |
Last |
Previous |
% Change |
Y-t-D Change |
| BSI |
794.01 |
796.76 |
-0.35% |
-18.71% |
| High |
801.90 |
798.20 |
|
|
| Low |
794.00 |
796.50 |
|
` |
| Volume |
40,218 |
45,875 |
|
|
| Val ($) |
216,457 |
315,968 |
|
|
I): BLOM preferred Shares Index (BPSI): today’s Performance
| |
Last |
Previous |
Change |
| BPSI |
80.07 |
80.07 |
0.00% |
| Volume |
– |
205 |
|
| Value |
– |
13,325 |
|
Lebanese Stocks: today’s Trades and Closing Prices
| |
Last Price ($) |
% Change |
Volume |
VWAP ($) |
| Solidere A |
5.64 |
-1.05% |
9,800 |
5.77 |
| Solidere B |
5.8 |
0.00% |
5,418 |
5.8 |
| Bank Audi |
3.65 |
-1.35% |
1,000 |
3.65 |
| BLOM GDR |
7.08 |
-0.14% |
24,000 |
7.08 |
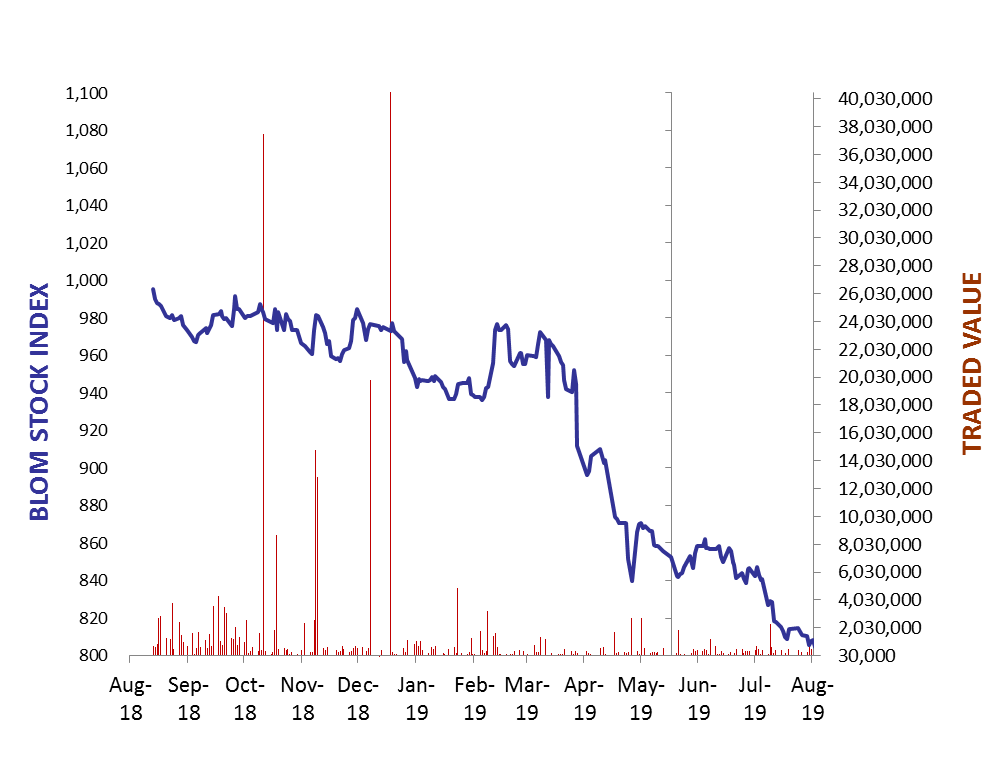
The BLOM Stock Index
Lebanese Global Depository Receipts: Last session’s Performance
| GDRs |
Last Price ($) |
Previous Price ($) |
% Change |
Volume |
Value ($) |
| BLOM GDR |
6.95 |
6.95 |
0.00% |
2,000 |
13,900 |
| Audi GDR |
3.7 |
3.7 |
0.00% |
– |
– |
| Byblos GDR |
77 |
77 |
0.00% |
– |
– |
Closing Date: 02 Sept. 2019
Source: London Stock Exchange
BLOM BOND INDEX: Last Session’s Performance
| |
Last |
Previous |
Change |
Y-t-D Change |
| BBI |
77.05 |
76.26 |
1.03% |
|
-23.76% |
| Weighted Yield |
14.82% |
15.08% |
-25 |
bps |
|
| Duration (Years) |
4.84 |
4.82 |
|
|
|
| 5Y Bond Yield |
16.66% |
16.88% |
-22 |
bps |
|
| 5Y Spread* |
1,524 |
1,544 |
-20 |
bps |
|
| 10Y Bond Yield |
13.50% |
13.80% |
-30 |
bps |
|
| 10Y Spread* |
1,205 |
1,234 |
-29 |
bps |
|
*between Lebanese Eurobonds and US Treasuries
Closing Date: 30 Aug 2019
Lebanese Eurobonds: Last Sessions’ Prices and Yields
|
Price |
Yield |
Yield Change |
| 12/04/2021 |
84.42 |
19.97% |
298 |
| 04/10/2022 |
75.22 |
16.66% |
-9 |
| 27/01/2023 |
73.42 |
16.50% |
50 |
| 22/04/2024 |
70.96 |
15.68% |
34 |
| 04/11/2024 |
69.40 |
14.94% |
-87 |
| 03/12/2024 |
70.41 |
15.41% |
80 |
| 26/02/2025 |
69.59 |
14.40% |
22 |
| 12/06/2025 |
70.02 |
13.97% |
-17 |
| 28/11/2026 |
67.03 |
13.97% |
-25 |
| 23/03/2027 |
67.00 |
14.08% |
31 |
| 29/11/2027 |
67.17 |
13.45% |
42 |
| 03/11/2028 |
66.93 |
12.90% |
18 |
| 26/02/2030 |
66.41 |
12.48% |
-33 |
| 22/04/2031 |
66.46 |
12.55% |
10 |
| 23/03/2032 |
66.46 |
12.31% |
43 |
| 02/11/2035 |
66.22 |
11.76% |
-22 |
| 23/03/2037 |
66.57 |
11.80% |
-20 |
Lebanese Forex Market
| |
Last Price |
Previous |
% Change |
Y-t-D |
| $/LBP |
1,514.25 |
1,514.25 |
– |
|
| €/LBP |
1,649.05 |
1,656.59 |
-0.46% |
|
| £/LBP |
1,815.93 |
1,832.52 |
-0.90% |
|
| NEER |
120.90 |
120.34 |
0.47% |
|
Closing Date: 03 Sept. 2019