Discover today’s performance of BLOM indices, the closing prices of Lebanese stocks and Eurobonds, as well as the exchange rate of major currencies against the LBP.
BLOM Stock Index (BSI) – today’s performance
| |
Last |
Previous |
% Change |
Y-t-D Change |
| BSI |
793.51 |
794.01 |
-0.06% |
-18.76% |
| High |
794.00 |
801.90 |
|
|
| Low |
793.10 |
794.00 |
|
` |
| Volume |
21,255 |
40,218 |
|
|
| Val ($) |
148,084 |
216,457 |
|
|
I): BLOM preferred Shares Index (BPSI): today’s Performance
| |
Last |
Previous |
Change |
| BPSI |
80.07 |
80.07 |
0.00% |
| Volume |
– |
– |
|
| Value |
– |
– |
|
Lebanese Stocks: today’s Trades and Closing Prices
| |
Last Price ($) |
% Change |
Volume |
VWAP ($) |
| Solidere A |
5.7 |
1.06% |
255 |
5.7 |
| Solidere B |
5.7 |
-1.72% |
4,000 |
5.7 |
| BLOM Listed |
7.28 |
-0.27% |
17,000 |
7.28 |
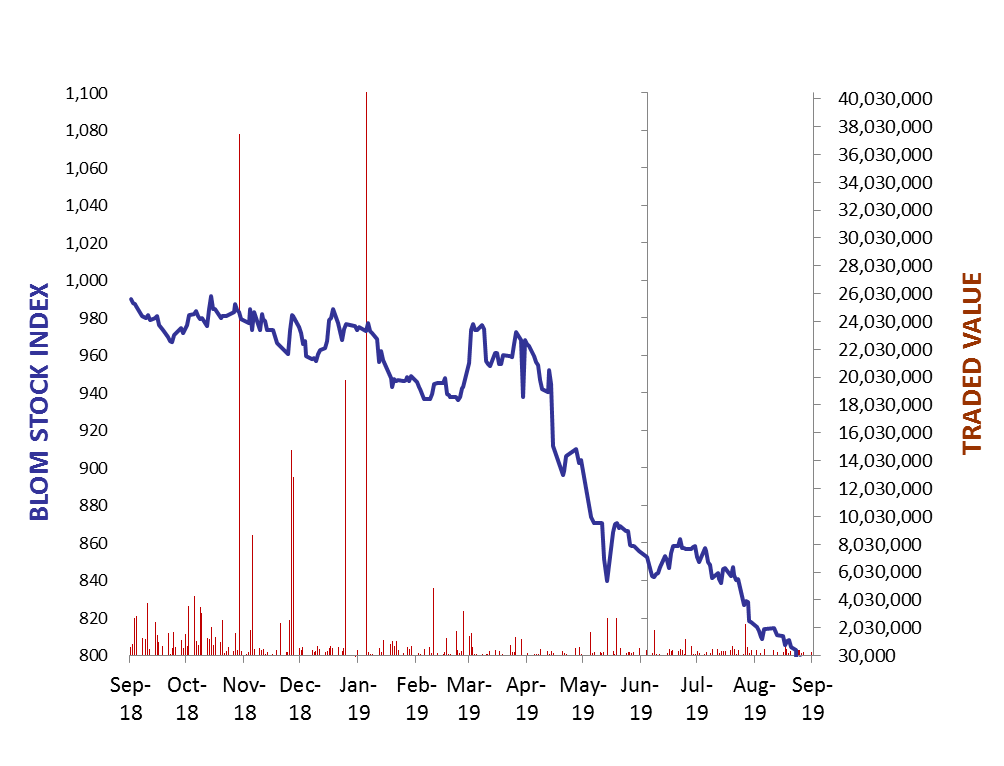
The BLOM Stock Index
Lebanese Global Depository Receipts: Last session’s Performance
| GDRs |
Last Price ($) |
Previous Price ($) |
% Change |
Volume |
Value ($) |
| BLOM GDR |
6.95 |
6.95 |
0.00% |
2,000 |
13,900 |
| Audi GDR |
3.7 |
3.7 |
0.00% |
– |
– |
| Byblos GDR |
77 |
77 |
0.00% |
– |
– |
Closing Date: 04 Sept. 2019
Source: London Stock Exchange
BLOM BOND INDEX: Last Session’s Performance
| |
Last |
Previous |
Change |
Y-t-D Change |
| BBI |
77.85 |
77.05 |
1.03% |
|
-22.97% |
| Weighted Yield |
14.54% |
14.82% |
-29 |
bps |
|
| Duration (Years) |
4.85 |
4.84 |
|
|
|
| 5Y Bond Yield |
16.59% |
16.66% |
-7 |
bps |
|
| 5Y Spread* |
1,521 |
1,524 |
-3 |
bps |
|
| 10Y Bond Yield |
13.43% |
13.50% |
-7 |
bps |
|
| 10Y Spread* |
1,201 |
1,205 |
-4 |
bps |
|
*between Lebanese Eurobonds and US Treasuries
Closing Date: 03 Sept. 2019
Lebanese Eurobonds: Last Sessions’ Prices and Yields
|
Price |
Yield |
Yield Change |
| 12/04/2021 |
86.02 |
18.69% |
-128 |
| 04/10/2022 |
75.42 |
16.59% |
-7 |
| 27/01/2023 |
73.46 |
16.50% |
0 |
| 22/04/2024 |
70.83 |
15.74% |
6 |
| 04/11/2024 |
69.38 |
14.96% |
2 |
| 03/12/2024 |
70.84 |
15.26% |
-14 |
| 26/02/2025 |
69.92 |
14.30% |
-10 |
| 12/06/2025 |
70.42 |
13.85% |
-12 |
| 28/11/2026 |
67.88 |
13.74% |
-24 |
| 23/03/2027 |
67.71 |
13.88% |
-19 |
| 29/11/2027 |
67.29 |
13.43% |
-3 |
| 03/11/2028 |
67.63 |
12.73% |
-17 |
| 26/02/2030 |
67.17 |
12.31% |
-17 |
| 22/04/2031 |
67.14 |
12.41% |
-15 |
| 23/03/2032 |
67.88 |
12.02% |
-29 |
| 02/11/2035 |
67.92 |
11.45% |
-31 |
| 23/03/2037 |
68.17 |
11.51% |
-29 |
Lebanese Forex Market
| |
Last Price |
Previous |
% Change |
Y-t-D |
| $/LBP |
1,514.25 |
1,514.25 |
– |
|
| €/LBP |
1,660.21 |
1,654.48 |
0.35% |
|
| £/LBP |
1,835.83 |
1,821.66 |
0.78% |
|
| NEER |
120.13 |
120.90 |
-0.64% |
|
Closing Date: 04 Sept. 2019