Discover today’s performance of BLOM indices, the closing prices of Lebanese stocks and Eurobonds, as well as the exchange rate of major currencies against the LBP.
BLOM Stock Index (BSI) – today’s performance
| |
Last |
Previous |
% Change |
Y-t-D Change |
| BSI |
794.22 |
794.71 |
-0.06% |
-18.69% |
| High |
798.00 |
795.40 |
|
|
| Low |
790.20 |
793.50 |
|
` |
| Volume |
325,391 |
40,493 |
|
|
| Val ($) |
1,347,538 |
275,955 |
|
|
I): BLOM preferred Shares Index (BPSI): today’s Performance
| |
Last |
Previous |
Change |
| BPSI |
80.07 |
80.07 |
0.00% |
| Volume |
– |
– |
|
| Value |
– |
– |
|
Lebanese Stocks: today’s Trades and Closing Prices
| |
Last Price ($) |
% Change |
Volume |
VWAP ($) |
| Solidere A |
5.96 |
2.23% |
14,165 |
5.96 |
| Solidere B |
5.71 |
0.88% |
15,132 |
5.71 |
| Bank Audi |
3.64 |
-0.27% |
250,000 |
3.64 |
| Byblos Bank Listed |
1.12 |
-2.61% |
9,794 |
1.12 |
| BLOM GDR |
7.08 |
0.00% |
36,300 |
7.08 |
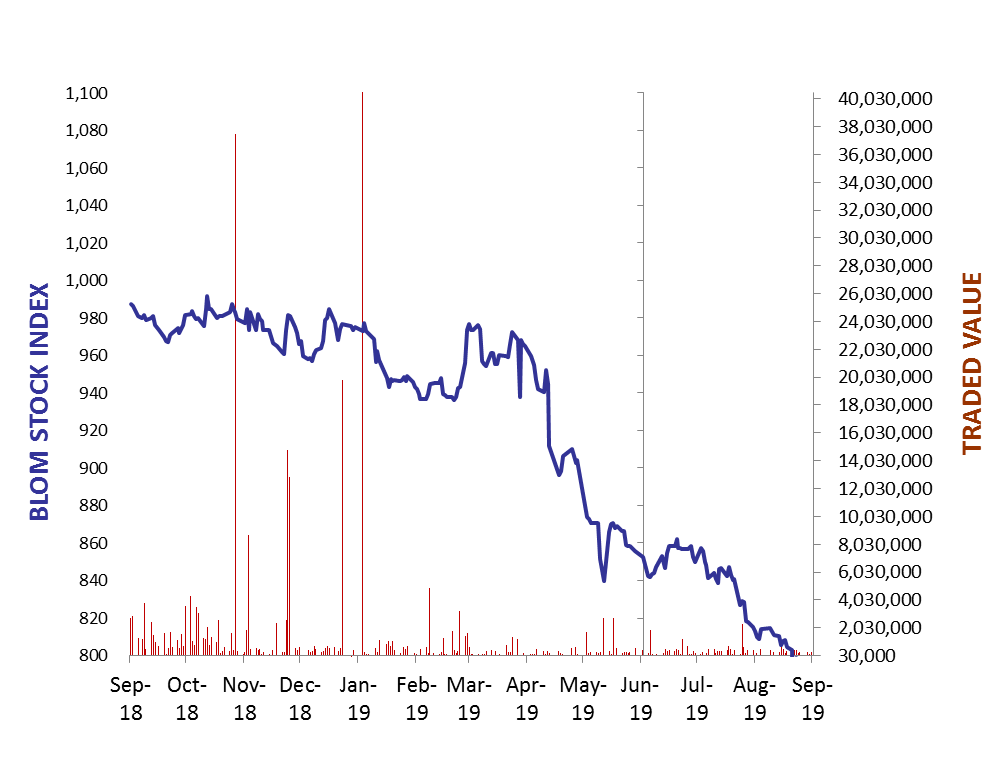
The BLOM Stock Index
Lebanese Global Depository Receipts: Last session’s Performance
| GDRs |
Last Price ($) |
Previous Price ($) |
% Change |
Volume |
Value ($) |
| BLOM GDR |
6.95 |
6.95 |
0.00% |
|
|
| Audi GDR |
3.7 |
3.7 |
0.00% |
– |
– |
| Byblos GDR |
77 |
77 |
0.00% |
– |
– |
Closing Date: 04 Sept. 2019
Source: London Stock Exchange
BLOM BOND INDEX: Last Session’s Performance
| |
Last |
Previous |
Change |
Y-t-D Change |
| BBI |
78.60 |
78.68 |
-0.11% |
|
-22.23% |
| Weighted Yield |
14.30% |
14.27% |
3 |
bps |
|
| Duration (Years) |
4.85 |
4.86 |
|
|
|
| 5Y Bond Yield |
16.30% |
16.33% |
-3 |
bps |
|
| 5Y Spread* |
1,483 |
1,497 |
-14 |
bps |
|
| 10Y Bond Yield |
13.20% |
13.22% |
-2 |
bps |
|
| 10Y Spread* |
1,169 |
1,182 |
-13 |
bps |
|
*between Lebanese Eurobonds and US Treasuries
Closing Date: 05 Sept. 2019
Lebanese Eurobonds: Last Sessions’ Prices and Yields
|
Price |
Yield |
Yield Change |
| 12/04/2021 |
86.68 |
18.18% |
16 |
| 04/10/2022 |
76.07 |
16.28% |
-2 |
| 27/01/2023 |
73.92 |
16.30% |
-2 |
| 22/04/2024 |
71.41 |
15.53% |
-1 |
| 04/11/2024 |
70.07 |
14.72% |
-4 |
| 03/12/2024 |
71.38 |
15.08% |
-3 |
| 26/02/2025 |
70.59 |
14.08% |
-8 |
| 12/06/2025 |
70.98 |
13.68% |
-2 |
| 28/11/2026 |
68.38 |
13.60% |
7 |
| 23/03/2027 |
68.38 |
13.70% |
6 |
| 29/11/2027 |
68.25 |
13.18% |
2 |
| 03/11/2028 |
68.34 |
12.56% |
0 |
| 26/02/2030 |
68.34 |
12.05% |
0 |
| 22/04/2031 |
68.01 |
12.22% |
-6 |
| 23/03/2032 |
68.63 |
11.87% |
6 |
| 02/11/2035 |
68.63 |
11.32% |
3 |
| 23/03/2037 |
68.63 |
11.43% |
9 |
Lebanese Forex Market
| |
Last Price |
Previous |
% Change |
Y-t-D |
| $/LBP |
1,514.25 |
1,514.25 |
– |
|
| €/LBP |
1,661.87 |
1,663.68 |
-0.11% |
|
| £/LBP |
1,853.92 |
1,858.90 |
-0.27% |
|
| NEER |
119.98 |
119.82 |
0.13% |
|
Closing Date: 06 Sept. 2019