Discover today’s performance of BLOM indices, the closing prices of Lebanese stocks and Eurobonds, as well as the exchange rate of major currencies against the LBP.
BLOM Stock Index (BSI) – today’s performance
| |
Last |
Previous |
% Change |
Y-t-D Change |
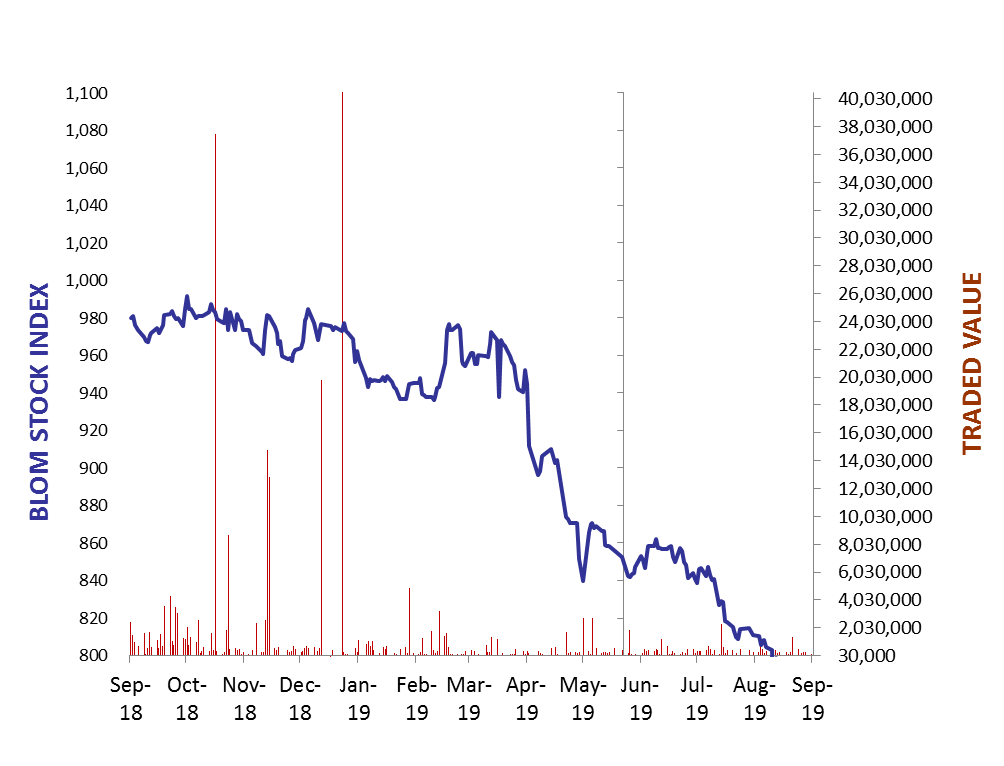
| BSI |
791.13 |
788.06 |
0.39% |
-19.01% |
| High |
793.00 |
793.20 |
|
|
| Low |
790.20 |
788.06 |
|
` |
| Volume |
855,680 |
81,546 |
|
|
| Val ($) |
15,299,304 |
168,982 |
|
|
I): BLOM preferred Shares Index (BPSI): today’s Performance
| |
Last |
Previous |
Change |
| BPSI |
80.07 |
80.07 |
0.00% |
| Volume |
– |
– |
|
| Value |
– |
– |
|
Lebanese Stocks: today’s Trades and Closing Prices
| |
Last Price ($) |
% Change |
Volume |
VWAP ($) |
| Solidere A |
5.8 |
1.58% |
3,805 |
5.8 |
| Solidere B |
5.76 |
3.41% |
5,865 |
5.75 |
| BOB Listed shares |
18.8 |
0.00% |
517,011 |
18.8 |
| BOB Priority Shares 2014 |
21 |
0.00% |
240,000 |
21 |
| Byblos Bank – Listed |
1.1 |
0.00% |
50,153 |
1.1 |
| Byblos Bank Pref 2008 |
65 |
0.00% |
2,438 |
65 |
| Byblos Bank Pref 2009 |
65 |
0.00% |
208 |
65 |
| BLOM GDR |
7.07 |
-0.14% |
36,000 |
7.07 |
| HOLCIM |
9.98 |
5.05% |
200 |
9.98 |
The BLOM Stock Index
Lebanese Global Depository Receipts: Last session’s Performance
| GDRs |
Last Price ($) |
Previous Price ($) |
% Change |
Volume |
Value ($) |
| BLOM GDR |
6.95 |
6.85 |
1.46% |
1,000 |
6,950 |
| Audi GDR |
3.76 |
3.76 |
0.00% |
– |
– |
| Byblos GDR |
70 |
70 |
0.00% |
– |
– |
Closing Date: 16 Sept. 2019
Source: London Stock Exchange
BLOM BOND INDEX: Last Session’s Performance
| |
Last |
Previous |
Change |
Y-t-D Change |
| BBI |
72.75 |
74.05 |
-1.75% |
|
-28.01% |
| Weighted Yield |
16.43% |
15.93% |
50 |
bps |
|
| Duration (Years) |
4.72 |
4.75 |
|
|
|
| 5Y Bond Yield |
19.30% |
18.90% |
40 |
bps |
|
| 5Y Spread* |
1,759 |
1,714 |
45 |
bps |
|
| 10Y Bond Yield |
14.63% |
14.30% |
33 |
bps |
|
| 10Y Spread* |
1,286 |
1,247 |
39 |
bps |
|
*between Lebanese Eurobonds and US Treasuries
Closing Date: 16 Sept. 2019
Lebanese Eurobonds: Last Sessions’ Prices and Yields
|
Price |
Yield |
Yield Change |
| 12/04/2021 |
82.38 |
22.09% |
106 |
| 04/10/2022 |
69.73 |
19.78% |
70 |
| 27/01/2023 |
68.19 |
19.27% |
58 |
| 22/04/2024 |
66.05 |
17.75% |
58 |
| 04/11/2024 |
65.20 |
16.57% |
28 |
| 03/12/2024 |
66.00 |
17.10% |
51 |
| 26/02/2025 |
65.05 |
16.07% |
27 |
| 12/06/2025 |
65.20 |
15.65% |
47 |
| 28/11/2026 |
63.05 |
15.22% |
40 |
| 23/03/2027 |
62.99 |
15.30% |
42 |
| 29/11/2027 |
63.04 |
14.62% |
36 |
| 03/11/2028 |
63.06 |
13.91% |
37 |
| 26/02/2030 |
62.86 |
13.34% |
33 |
| 22/04/2031 |
62.55 |
13.47% |
14 |
| 23/03/2032 |
63.11 |
13.06% |
28 |
| 02/11/2035 |
63.11 |
12.38% |
27 |
| 23/03/2037 |
63.11 |
12.48% |
26 |
Lebanese Forex Market
| |
Last Price |
Previous |
% Change |
Y-t-D |
| $/LBP |
1,514.25 |
1,514.25 |
– |
|
| €/LBP |
1,661.87 |
1,662.02 |
-0.01% |
|
| £/LBP |
1,872.77 |
1,873.82 |
-0.06% |
|
| NEER |
119.73 |
119.533 |
0.16% |
|
Closing Date: 17 Sept. 2019


