Discover today’s performance of BLOM indices, the closing prices of Lebanese stocks and Eurobonds, as well as the exchange rate of major currencies against the LBP.
BLOM Stock Index (BSI) – Today’s performance
| |
Last |
Previous |
% Change |
Y-t-D Change |
| BSI |
628.26 |
629.65 |
-0.22% |
-20.02% |
| High |
629.70 |
629.70 |
|
|
| Low |
627.10 |
623.90 |
|
|
| Volume |
48,632 |
27,500 |
|
|
| Val ($) |
386,827 |
215,917 |
|
|
I): BLOM preferred Shares Index (BPSI): today’s Performance
| |
Last |
Previous |
Change |
| BPSI |
66.67 |
66.67 |
0.00% |
| Volume |
– |
– |
|
| Value |
– |
– |
|
Lebanese Stocks: today’s Trades and Closing Prices
| |
Last Price ($) |
% Change |
Volume |
VWAP ($) |
| Solidere A |
8.5 |
-1.05% |
42,828 |
8.5 |
| Solidere B |
8.5 |
-0.12% |
1,800 |
8.5 |
| Bank Audi |
1.89 |
-0.53% |
4,000 |
1.9 |
| BLOM – Listed |
4 |
0.00% |
4 |
4 |
Closing Date: 02 March 2020
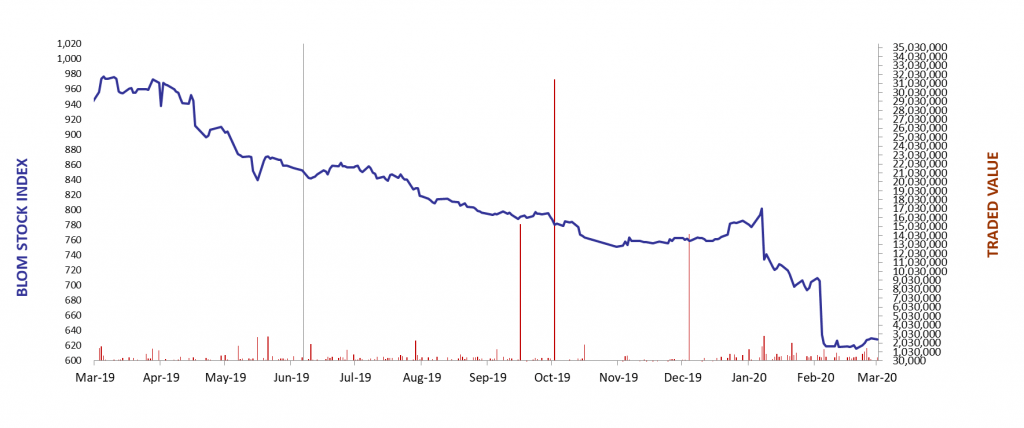
The BLOM Stock Index
Lebanese Global Depository Receipts: Last Session’s Performance
| GDRs |
Last Price ($) |
Previous Price ($) |
% Change |
Volume |
Value ($) |
| BLOM GDR |
1.70 |
1.90 |
-10.53% |
3,630 |
6,326 |
| Audi GDR |
1.4 |
1.4 |
0.00% |
– |
– |
| Byblos GDR |
70 |
70 |
0.00% |
– |
– |
Closing Date: 28 February 2020
Source: London Stock Exchange
BLOM BOND INDEX: Last Session’s Performance
| |
Last |
Previous |
Change |
Y-t-D Change |
| BBI |
28.28 |
27.81 |
1.72% |
|
-44.11% |
| Weighted Yield |
60.27% |
61.39% |
-112 |
bps |
|
| Duration (Years) |
3.20 |
3.18 |
|
|
|
| 5Y Bond Yield |
70.60% |
70.40% |
20 |
bps |
|
| 5Y Spread* |
6,975 |
6,932 |
43 |
bps |
|
| 10Y Bond Yield |
36.00% |
36.20% |
-20 |
bps |
|
| 10Y Spread* |
3,497 |
3,498 |
-1 |
bps |
|
*between Lebanese Eurobonds and US Treasuries
Closing Date: 28 February 2020
Lebanese Eurobonds: Last Sessions’ Prices and Yields
|
Price |
Yield |
Yield Change |
| 4/12/2021 |
27.55 |
176.06% |
-541 |
| 10/4/2022 |
25.83 |
74.48% |
-30 |
| 1/27/2023 |
26.41 |
65.81% |
-162 |
| 4/22/2024 |
25.65 |
51.87% |
-12 |
| 11/4/2024 |
27.18 |
44.44% |
-174 |
| 12/3/2024 |
26.58 |
46.66% |
-132 |
| 2/26/2025 |
25.58 |
44.45% |
55 |
| 6/12/2025 |
26.81 |
41.24% |
-40 |
| 11/28/2026 |
25.60 |
37.56% |
-77 |
| 3/23/2027 |
25.52 |
37.42% |
-38 |
| 11/29/2027 |
25.08 |
35.86% |
-24 |
| 11/3/2028 |
25.79 |
33.00% |
-39 |
| 2/26/2030 |
25.68 |
31.19% |
11 |
| 4/22/2031 |
25.29 |
31.46% |
-9 |
| 3/23/2032 |
25.60 |
30.35% |
-64 |
| 11/2/2035 |
25.07 |
29.33% |
-23 |
| 3/23/2037 |
25.64 |
29.11% |
-83 |
Lebanese Forex Market
| |
Last Price |
Previous |
% Change |
Y-t-D |
| $/LBP |
1,514.25 |
1,514.25 |
– |
|
| €/LBP |
1,676.49 |
1,662.32 |
0.85% |
|
| £/LBP |
1,925.68 |
1,932.01 |
-0.33% |
|
| NEER |
119.13 |
119.63 |
-0.42% |
|
Closing Date: 02 March 2020