Discover today’s performance of BLOM indices, the closing prices of Lebanese stocks and Eurobonds, as well as the exchange rate of major currencies against the LBP.
BLOM Stock Index (BSI) – Today’s performance
| |
Last |
Previous |
% Change |
Y-t-D Change |
| BSI |
635.93 |
628.26 |
1.22% |
-19.05% |
| High |
635.93 |
629.70 |
|
|
| Low |
626.84 |
627.10 |
|
|
| Volume |
27,197 |
48,632 |
|
|
| Val ($) |
233,908 |
386,827 |
|
|
I): BLOM preferred Shares Index (BPSI): today’s Performance
| |
Last |
Previous |
Change |
| BPSI |
66.67 |
66.67 |
0.00% |
| Volume |
– |
– |
|
| Value |
– |
– |
|
Lebanese Stocks: today’s Trades and Closing Prices
| |
Last Price ($) |
% Change |
Volume |
VWAP ($) |
| Solidere A |
8.61 |
1.29% |
12,373 |
8.61 |
| Solidere B |
8.7 |
2.35% |
14,546 |
8.7 |
| BLOM – Listed |
4 |
0.00% |
7 |
4 |
| BLOM GDR |
3.69 |
23.00% |
271 |
3.69 |
Closing Date: 03 March 2020
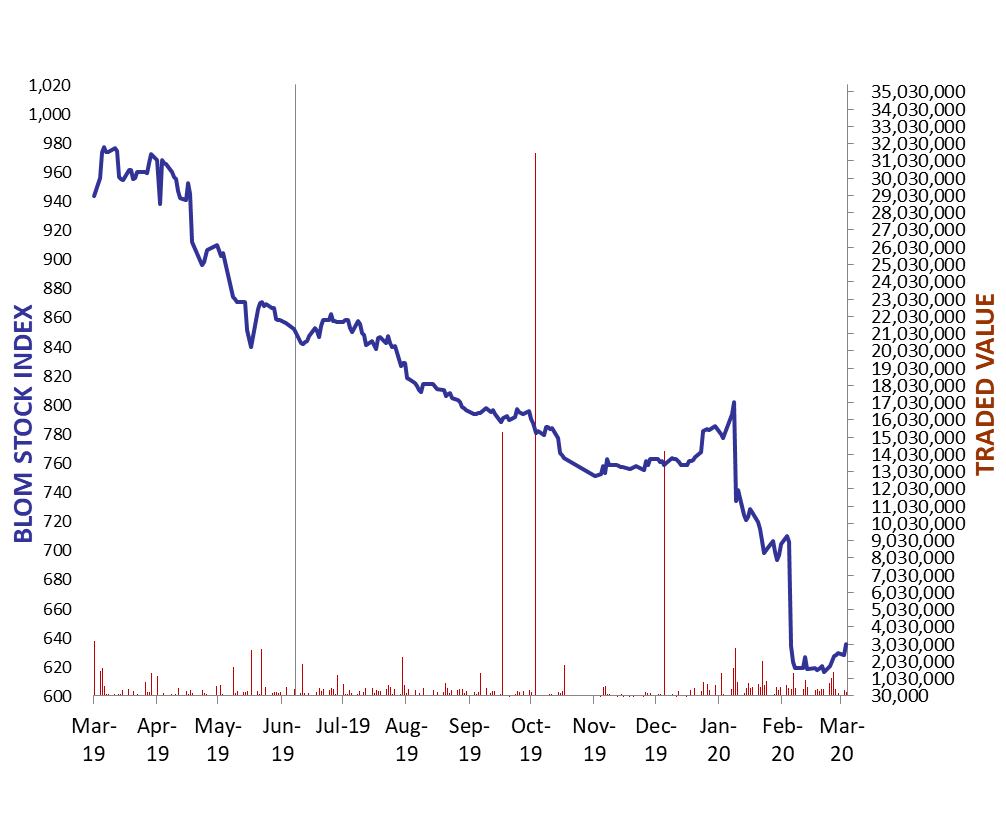
The BLOM Stock Index
Lebanese Global Depository Receipts: Last Session’s Performance
| GDRs |
Last Price ($)
|
Previous Price ($) Last trade: Feb 28th |
% Change |
Volume |
Value ($) |
| BLOM GDR |
1.70 |
1.70 |
0.00% |
– |
– |
| Audi GDR |
1.4 |
1.4 |
0.00% |
– |
– |
| Byblos GDR |
70 |
70 |
0.00% |
– |
– |
Updated: on March 02, 2020
Source: London Stock Exchange
BLOM BOND INDEX: Last Session’s Performance
| |
Last |
Previous |
Change |
Y-t-D Change |
| BBI |
29.22 |
28.28 |
3.29% |
|
-42.27% |
| Weighted Yield |
58.98% |
60.27% |
-129 |
bps |
|
| Duration (Years) |
3.24 |
3.20 |
|
|
|
| 5Y Bond Yield |
70.00% |
70.60% |
-60 |
bps |
|
| 5Y Spread* |
6,915 |
6,975 |
-60 |
bps |
|
| 10Y Bond Yield |
35.50% |
36.00% |
-50 |
bps |
|
| 10Y Spread* |
3,449 |
3,497 |
-48 |
bps |
|
*between Lebanese Eurobonds and US Treasuries
Closing Date: 02 March 2020
Lebanese Eurobonds: Last Sessions’ Prices and Yields
|
Price |
Yield |
Yield Change |
| 12/04/2021 |
28.29 |
173.58% |
-248 |
| 04/10/2022 |
27.22 |
71.61% |
-287 |
| 27/01/2023 |
27.00 |
64.82% |
-98 |
| 22/04/2024 |
27.25 |
49.55% |
-231 |
| 04/11/2024 |
27.42 |
44.20% |
-24 |
| 03/12/2024 |
26.88 |
46.31% |
-35 |
| 26/02/2025 |
26.97 |
42.70% |
-175 |
| 12/06/2025 |
27.05 |
41.00% |
-23 |
| 28/11/2026 |
26.13 |
37.00% |
-55 |
| 23/03/2027 |
26.20 |
36.70% |
-72 |
| 29/11/2027 |
25.81 |
35.09% |
-76 |
| 03/11/2028 |
26.25 |
32.56% |
-44 |
| 26/02/2030 |
27.38 |
29.63% |
-157 |
| 22/04/2031 |
26.34 |
30.43% |
-103 |
| 23/03/2032 |
26.02 |
29.96% |
-39 |
| 02/11/2035 |
26.16 |
28.24% |
-109 |
| 23/03/2037 |
26.26 |
28.48% |
-62 |
Lebanese Forex Market
| |
Last Price |
Previous |
% Change |
Y-t-D |
| $/LBP |
1,514.25 |
1,514.25 |
– |
|
| €/LBP |
1,676.49 |
1,662.32 |
0.85% |
|
| £/LBP |
1,925.68 |
1,932.01 |
-0.33% |
|
| NEER |
119.13 |
119.63 |
-0.42% |
|
Closing Date: 02 March 2020