Discover today’s performance of BLOM indices, the closing prices of Lebanese stocks and Eurobonds, as well as the exchange rate of major currencies against the LBP.
BLOM Stock Index (BSI) – Today’s performance
| |
Last |
Previous |
% Change |
Y-t-D Change |
| BSI |
625.04 |
622.94 |
0.34% |
-20.43% |
| High |
625.04 |
625.11 |
|
|
| Low |
624.30 |
621.40 |
|
|
| Volume |
294,423 |
64,774 |
|
|
| Val ($) |
1,775,035 |
460,129 |
|
|
I): BLOM preferred Shares Index (BPSI): today’s Performance
| |
Last |
Previous |
Change |
| BPSI |
66.67 |
66.67 |
0.00% |
| Volume |
– |
– |
|
| Value |
– |
– |
|
Lebanese Stocks: today’s Trades and Closing Prices
| |
Last Price ($) |
% Change |
Volume |
VWAP ($) |
| Solidere A |
9 |
1.58% |
151,860 |
9 |
| Solidere B |
9 |
4.17% |
40,655 |
9 |
| Byblos Listed |
0.85 |
-3.41% |
101,901 |
0.85 |
| BLOM Listed |
4 |
0.00% |
7 |
4 |
Closing Date: 09 March 2020
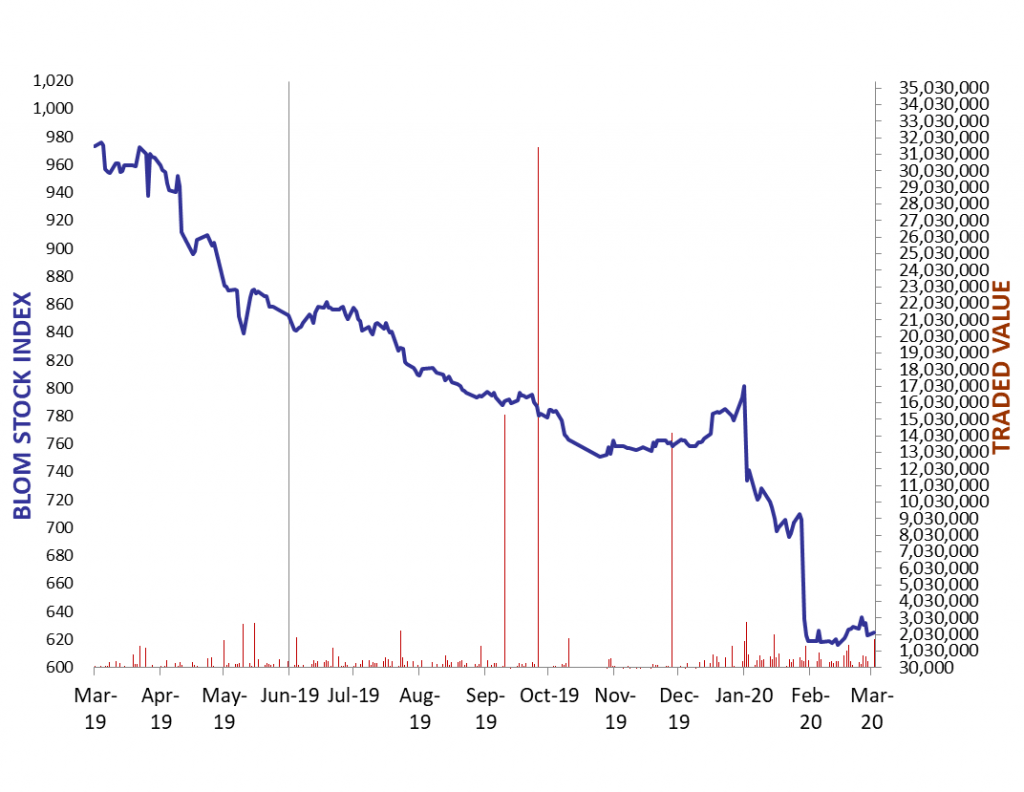
The BLOM Stock Index
Lebanese Global Depository Receipts: Last Session’s Performance
| GDRs |
Last Price ($) |
Previous Price ($) |
% Change |
Volume |
Value ($) |
| BLOM GDR |
1.70 |
1.70 |
0.00% |
11,000 |
18,700 |
| Audi GDR |
1.4 |
1.4 |
0.00% |
– |
– |
| Byblos GDR |
70 |
70 |
0.00% |
– |
– |
Closing Date: March 06, 2020
Source: London Stock Exchange
BLOM BOND INDEX: Last Session’s Performance
| |
Last |
Previous |
Change |
Y-t-D Change |
| BBI |
26.94 |
27.96 |
-3.63% |
|
-46.71% |
| Weighted Yield |
63.00% |
61.34% |
167 |
bps |
|
| Duration (Years) |
3.08 |
3.15 |
|
|
|
| 5Y Bond Yield |
72.88% |
70.40% |
248 |
bps |
|
| 5Y Spread* |
7,235 |
6,979 |
256 |
bps |
|
| 10Y Bond Yield |
37.50% |
36.40% |
110 |
bps |
|
| 10Y Spread* |
3,681 |
3,559 |
122 |
bps |
|
*between Lebanese Eurobonds and US Treasuries
Closing Date: 06 March 2020
Lebanese Eurobonds: Last Sessions’ Prices and Yields
|
Price |
Yield |
Yield Change |
| 12/04/2021 |
26.85 |
184.99% |
378 |
| 04/10/2022 |
25.87 |
74.96% |
44 |
| 27/01/2023 |
24.98 |
69.20% |
283 |
| 22/04/2024 |
24.60 |
53.72% |
195 |
| 04/11/2024 |
24.80 |
47.79% |
220 |
| 03/12/2024 |
25.04 |
48.82% |
152 |
| 26/02/2025 |
24.50 |
46.01% |
165 |
| 12/06/2025 |
25.63 |
42.76% |
117 |
| 28/11/2026 |
24.38 |
39.04% |
94 |
| 23/03/2027 |
23.65 |
39.73% |
169 |
| 29/11/2027 |
23.82 |
37.33% |
119 |
| 03/11/2028 |
23.65 |
35.30% |
165 |
| 26/02/2030 |
24.58 |
32.30% |
96 |
| 22/04/2031 |
24.12 |
32.64% |
150 |
| 23/03/2032 |
24.26 |
31.75% |
67 |
| 02/11/2035 |
23.49 |
31.06% |
131 |
| 23/03/2037 |
23.41 |
31.63% |
173 |
Lebanese Forex Market
| |
Last Price |
Previous |
% Change |
Y-t-D |
| $/LBP |
1,514.25 |
1,514.25 |
– |
|
| €/LBP |
1,723.68 |
1,701.36 |
1.31% |
|
| £/LBP |
1,980.25 |
1,966.84 |
0.68% |
|
| NEER |
118.21 |
118.09 |
0.10% |
|
Closing Date: 09 March 2020