Discover today’s performance of BLOM indices, the closing prices of Lebanese stocks and Eurobonds, as well as the exchange rate of major currencies against the LBP.
BLOM Stock Index (BSI) – Today’s performance
| |
Last |
Previous |
% Change |
Y-t-D Change |
| BSI |
618.03 |
623.63 |
-0.90% |
-21.33% |
| High |
623.64 |
625.17 |
|
|
| Low |
617.88 |
618.57 |
|
|
| Volume |
49,407 |
93,761 |
|
|
| Val ($) |
439,102 |
819,722 |
|
|
I): BLOM preferred Shares Index (BPSI): today’s Performance
| |
Last |
Previous |
Change |
| BPSI |
66.67 |
66.67 |
0.00% |
| Volume |
– |
– |
|
| Value |
– |
– |
|
Lebanese Stocks: today’s Trades and Closing Prices
| |
Last Price ($) |
% Change |
Volume |
VWAP ($) |
| Solidere A |
8.86 |
-1.34% |
47,128 |
8.9 |
| Solidere B |
8.89 |
0.79% |
2,217 |
8.9 |
| BLOM Listed |
3.9 |
-2.50% |
31 |
3.9 |
| BLOM GDRs |
3.5 |
-9.09% |
31 |
3.5 |
Closing Date: 11 March 2020
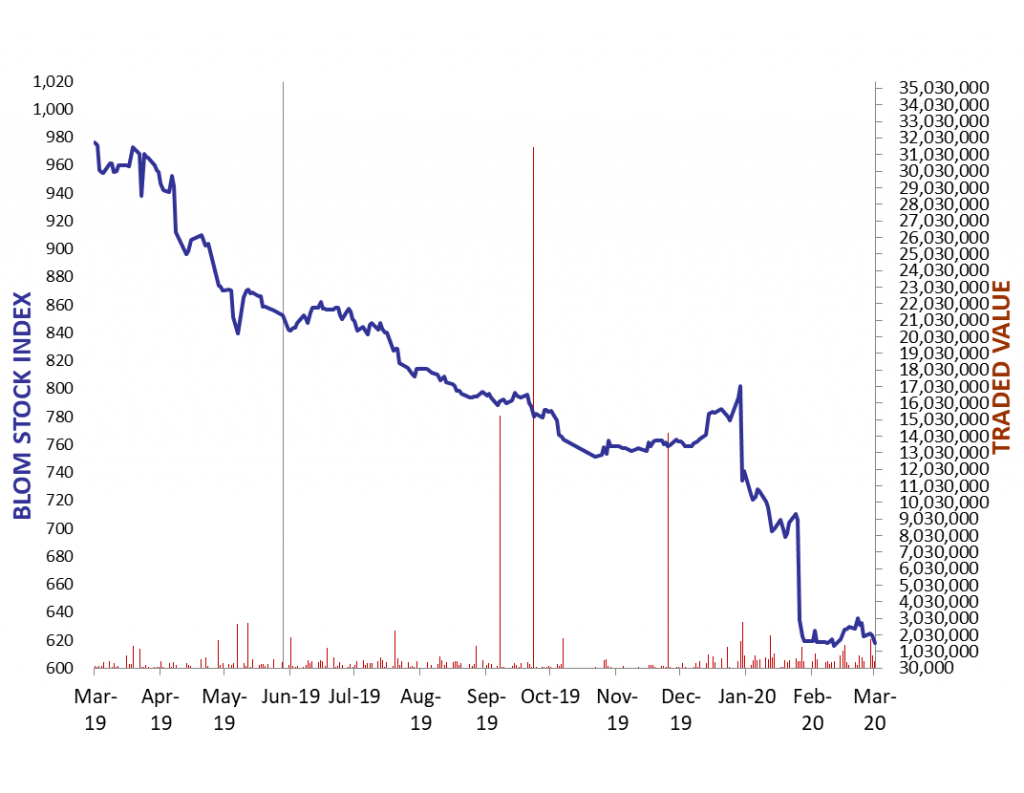
The BLOM Stock Index
Lebanese Global Depository Receipts: Last Session’s Performance
| GDRs |
Last Price ($) |
Previous Price ($) |
% Change |
Volume |
Value ($) |
| BLOM GDR |
1.70 |
1.70 |
0.00% |
– |
– |
| Audi GDR |
1.4 |
1.4 |
0.00% |
– |
– |
| Byblos GDR |
70 |
70 |
0.00% |
– |
– |
Closing Date: March 10th 2020
Source: London Stock Exchange
BLOM BOND INDEX: Last Session’s Performance
| |
Last |
Previous |
Change |
Y-t-D Change |
| BBI |
25.63 |
25.51 |
0.49% |
|
-49.30% |
| Weighted Yield |
67.77% |
67.62% |
15 |
bps |
|
| Duration (Years) |
3.03 |
3.02 |
|
|
|
| 5Y Bond Yield |
77.56% |
77.50% |
6 |
bps |
|
| 5Y Spread* |
7,698 |
7,710 |
-12 |
bps |
|
| 10Y Bond Yield |
38.64% |
38.54% |
10 |
bps |
|
| 10Y Spread* |
3,791 |
3,798 |
-7 |
bps |
|
*between Lebanese Eurobonds and US Treasuries
Closing Date: 10 March 2020
Lebanese Eurobonds: Last Sessions’ Prices and Yields
|
Price |
Yield |
Yield Change |
| 4/12/2021 |
23.83 |
209.88% |
204 |
| 10/4/2022 |
23.25 |
81.97% |
66 |
| 1/27/2023 |
23.60 |
72.58% |
18 |
| 4/22/2024 |
23.61 |
55.53% |
33 |
| 11/4/2024 |
23.96 |
49.14% |
(11) |
| 12/3/2024 |
23.76 |
50.89% |
2 |
| 2/26/2025 |
23.46 |
47.59% |
4 |
| 6/12/2025 |
24.37 |
44.50% |
(59) |
| 11/28/2026 |
23.42 |
40.29% |
(30) |
| 3/23/2027 |
23.49 |
39.98% |
(25) |
| 11/29/2027 |
23.47 |
37.79% |
(62) |
| 11/3/2028 |
23.68 |
35.28% |
(58) |
| 2/26/2030 |
23.46 |
33.54% |
(24) |
| 4/22/2031 |
23.69 |
33.13% |
(11) |
| 3/23/2032 |
23.60 |
32.51% |
(49) |
| 11/2/2035 |
23.46 |
31.10% |
(25) |
| 3/23/2037 |
23.46 |
31.58% |
(12) |
Lebanese Forex Market
| |
Last Price |
Previous |
% Change |
Y-t-D |
| $/LBP |
1,514.25 |
1,514.25 |
– |
|
| €/LBP |
1,710.41 |
1,700.91 |
0.56% |
|
| £/LBP |
1,952.82 |
1,946.03 |
0.35% |
|
| NEER |
118.60 |
118.35 |
0.21% |
|
Closing Date: 11 March 2020