Discover today’s performance of BLOM indices, the closing prices of Lebanese stocks and Eurobonds, as well as the exchange rate of major currencies against the LBP.
BLOM Stock Index (BSI) – Today’s performance
| |
Last |
Previous |
% Change |
Y-t-D Change |
| BSI |
591.53 |
596.91 |
-0.90% |
-24.70% |
| High |
593.10 |
597.12 |
|
|
| Low |
591.50 |
595.72 |
|
|
| Volume |
18,133 |
26,355 |
|
|
| Val ($) |
156,316 |
236,445 |
|
|
I): BLOM preferred Shares Index (BPSI): today’s Performance
| |
Last |
Previous |
Change |
| BPSI |
66.67 |
66.67 |
0.00% |
| Volume |
– |
– |
|
| Value |
– |
– |
|
Lebanese Stocks: today’s Trades and Closing Prices
| |
Last Price ($) |
% Change |
Volume |
VWAP ($) |
| Solidere A |
9.00 |
-0.33% |
14,600 |
9 |
| Solidere B |
8.98 |
-0.22% |
2,682 |
8.98 |
| Byblos Listed |
0.81 |
-10.00% |
850 |
0.81 |
| BLOM Listed |
3 |
0.00% |
1 |
3 |
Closing Date: 26 March 2020
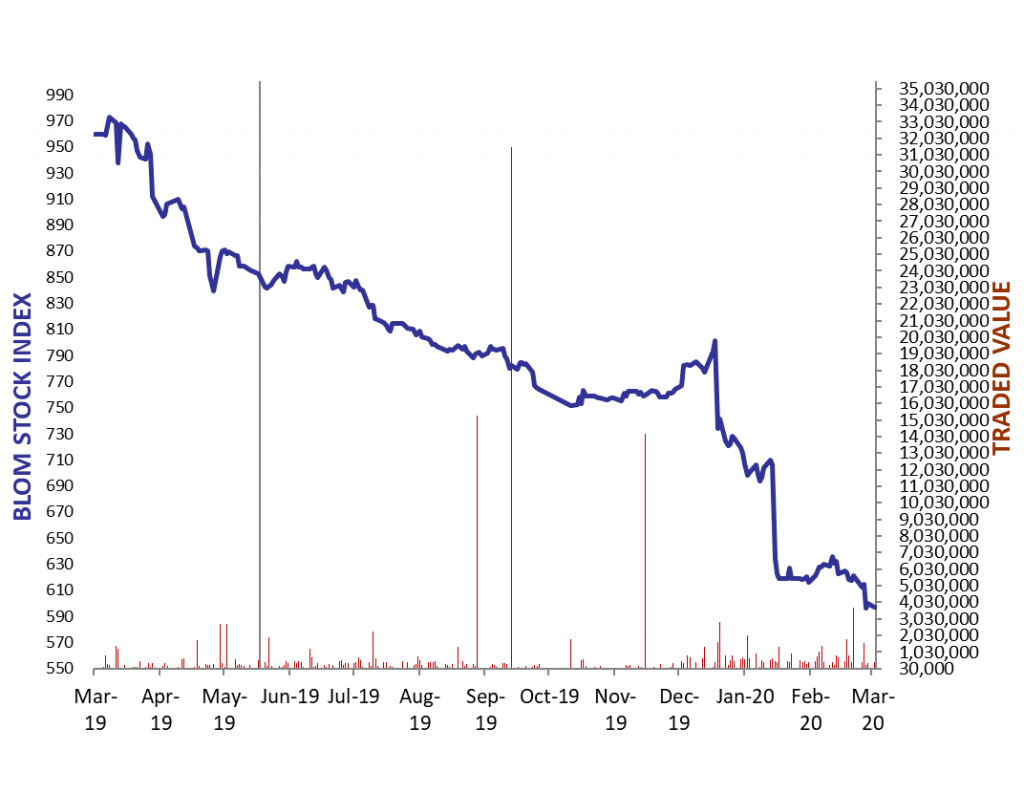
The BLOM Stock Index
Lebanese Global Depository Receipts: Last Session’s Performance
| GDRs |
Last Price ($) |
Previous Price ($) |
% Change |
Volume |
Value ($) |
| BLOM GDR |
1.70 |
1.70 |
0.00% |
12,400 |
21,080 |
| Audi GDR |
1.4 |
1.4 |
0.00% |
– |
– |
| Byblos GDR |
70 |
70 |
0.00% |
– |
– |
Closing Date: March 24th 2020
Source: London Stock Exchange
BLOM BOND INDEX: Last Session’s Performance
| |
Last |
Previous |
Change |
Y-t-D Change |
| BBI |
16.13 |
15.33 |
5.22% |
|
-68.09% |
| Weighted Yield |
100.94% |
103.31% |
-237 |
bps |
|
| Duration (Years) |
2.37 |
2.29 |
|
|
|
| 5Y Bond Yield |
109.20% |
114.40% |
-520 |
bps |
|
| 5Y Spread* |
10,876 |
11,409 |
-533 |
bps |
|
| 10Y Bond Yield |
53.40% |
56.60% |
-320 |
bps |
|
| 10Y Spread* |
5,265 |
5,597 |
-332 |
bps |
|
*between Lebanese Eurobonds and US Treasuries
Closing Date: 24 March 2020
Lebanese Eurobonds: Last Sessions’ Prices and Yields
|
Price |
Yield |
Yield Change |
| 12/04/2021 |
14.67 |
333.89% |
127 |
| 04/10/2022 |
14.42 |
116.96% |
(422) |
| 27/01/2023 |
15.00 |
101.11% |
(591) |
| 22/04/2024 |
14.88 |
77.35% |
(341) |
| 04/11/2024 |
15.00 |
68.66% |
(295) |
| 03/12/2024 |
15.01 |
70.79% |
61 |
| 26/02/2025 |
14.88 |
65.80% |
(258) |
| 12/06/2025 |
15.75 |
60.94% |
(243) |
| 28/11/2026 |
14.83 |
56.33% |
(293) |
| 23/03/2027 |
14.83 |
56.47% |
(53) |
| 29/11/2027 |
14.83 |
53.45% |
(302) |
| 03/11/2028 |
14.83 |
50.68% |
(208) |
| 26/02/2030 |
14.88 |
48.37% |
(248) |
| 22/04/2031 |
14.83 |
49.19% |
(222) |
| 23/03/2032 |
14.83 |
48.69% |
(243) |
| 02/11/2035 |
14.88 |
47.54% |
(330) |
| 23/03/2037 |
14.83 |
49.03% |
(312) |
Lebanese Forex Market
| |
Last Price |
Previous |
% Change |
Y-t-D |
| $/LBP |
1,514.25 |
1,514.25 |
– |
|
| €/LBP |
1,653.88 |
1,691.26 |
-2.21% |
|
| £/LBP |
1,805.53 |
1,917.99 |
-5.86% |
|
| NEER |
122.34 |
123.00 |
-0.53% |
|
Closing Date: 26 March 2020