Discover today’s performance of BLOM indices, the closing prices of Lebanese stocks and Eurobonds, as well as the exchange rate of major currencies against the LBP.
BLOM Stock Index (BSI) – today’s performance
| |
Last |
Previous |
% Change |
Y-t-D Change |
| BSI |
589.07 |
578.27 |
1.87% |
-25.01% |
| High |
589.87 |
579.42 |
|
|
| Low |
578.27 |
574.46 |
|
|
| Volume |
46,804 |
211,193 |
|
|
| Val ($) |
495,761 |
2,290,849 |
|
|
I): BLOM preferred Shares Index (BPSI): today’s Performance
| |
Last |
Previous |
Change |
| BPSI |
62.69 |
62.69 |
0.00% |
| Volume |
– |
– |
|
| Value |
– |
– |
|
Lebanese Stocks: today’s Trades and Closing Prices
| |
Last Price ($) |
% Change |
Volume |
VWAP ($) |
| Solidere A |
11.24 |
2.18% |
30,533 |
11.1 |
| Solidere B |
10.89 |
0.55% |
13,231 |
11 |
| BLOM Listed Shares |
3.85 |
10.32% |
3,000 |
3.9 |
| Ciments Blancs (N) |
3.80 |
18.75% |
40 |
3.8 |
Closing Date: June 16th 2020
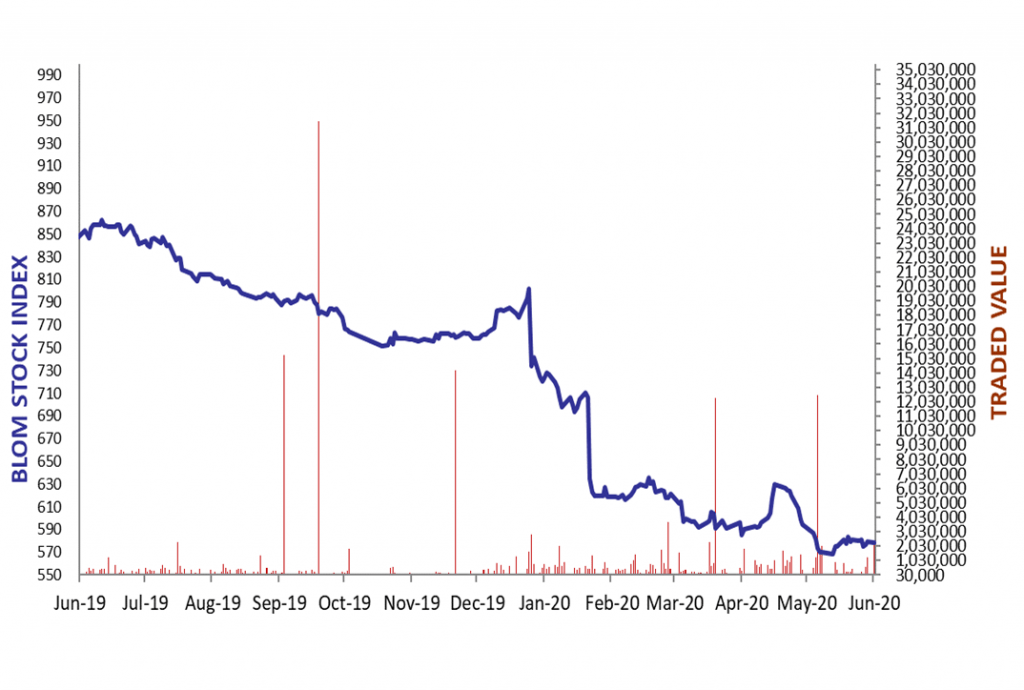
The BLOM Stock Index
Lebanese Global Depository Receipts: Last Session’s Performance
| Global Depository Receipts (GDRs) |
Last Price ($) |
Previous Price ($)
June 12th 2020 |
% Change |
Volume |
Value ($) |
| BLOM GDR |
1.500 |
1.500 |
0.00% |
7,500 |
11,250 |
| Audi GDR |
0.43 |
0.43 |
0.00% |
– |
– |
| Byblos GDR |
70 |
70 |
0.00% |
– |
– |
Closing Date: June 16, 2020
Source: London Stock Exchange
BLOM BOND INDEX: Last Session’s Performance
| |
Last |
Previous |
Change |
Y-t-D Change |
| BBI |
18.19 |
18.59 |
-2.12% |
|
-64.01% |
| Weighted Yield |
56.99% |
55.98% |
100 |
bps |
|
| Duration (Years) |
3.03 |
3.08 |
|
|
|
| 5Y Bond Yield |
98.72% |
96.20% |
252 |
bps |
|
| 5Y Spread* |
9,853 |
9,601 |
252 |
bps |
|
| 10Y Bond Yield |
44.76% |
44.50% |
26 |
bps |
|
| 10Y Spread* |
4,443 |
4,417 |
26 |
bps |
|
*spread between Lebanese Eurobonds and US Treasuries
Closing Date: June 15th 2020
Lebanese Eurobonds: Last Sessions’ Prices and Yields
|
Price |
Yield |
Yield Change |
| 04/10/2022 |
19.63 |
103.20% |
224 |
| 27/01/2023 |
19.17 |
92.60% |
184 |
| 22/04/2024 |
18.75 |
69.08% |
136 |
| 04/11/2024 |
19.08 |
60.63% |
125 |
| 03/12/2024 |
19.33 |
61.97% |
(51) |
| 26/02/2025 |
19.33 |
56.87% |
37 |
| 12/06/2025 |
20.17 |
53.18% |
(3) |
| 28/11/2026 |
19.35 |
47.56% |
38 |
| 23/03/2027 |
18.75 |
48.19% |
72 |
| 29/11/2027 |
19.33 |
44.63% |
39 |
| 03/11/2028 |
18.75 |
42.89% |
148 |
| 26/02/2030 |
18.50 |
40.84% |
96 |
| 22/04/2031 |
19.17 |
39.86% |
27 |
| 23/03/2032 |
18.75 |
39.67% |
118 |
| 02/11/2035 |
19.13 |
37.62% |
131 |
| 23/03/2037 |
20.38 |
36.05% |
120 |
Lebanese Forex Market
| |
Last Price |
Previous |
% Change |
Y-t-D |
| $/LBP |
1,514.25 |
1,514.25 |
– |
|
| €/LBP |
1,705.13 |
1,706.19 |
-0.06% |
|
| £/LBP |
1,905.03 |
1,905.48 |
-0.02% |
|
| NEER |
121.48 |
121.89 |
-0.34% |
|
Closing Date: June 16, 2020