Discover today’s performance of BLOM indices, the closing prices of Lebanese stocks and Eurobonds, as well as the exchange rate of major currencies against the LBP.
BLOM Stock Index (BSI) – today’s performance
| |
Last |
Previous |
% Change |
Y-t-D Change |
| BSI |
613.56 |
608.41 |
0.85% |
-21.89% |
| High |
616.00 |
610.82 |
|
|
| Low |
606.19 |
595.50 |
|
|
| Volume |
134,830 |
79,196 |
|
|
| Val ($) |
1,931,056 |
732,531 |
|
|
I): BLOM preferred Shares Index (BPSI): today’s Performance
| |
Last |
Previous |
Change |
| BPSI |
62.69 |
62.69 |
0.00% |
| Volume |
– |
– |
|
| Value |
– |
– |
|
Lebanese Stocks: today’s Trades and Closing Prices
| |
Last Price ($) |
% Change |
Volume |
VWAP ($) |
| Solidere A |
14.23 |
1.35% |
119,259 |
14.32 |
| Solidere B |
14.50 |
3.72% |
15,571 |
14.50 |
|
|
|
|
|
Closing Date: July 09, 2020
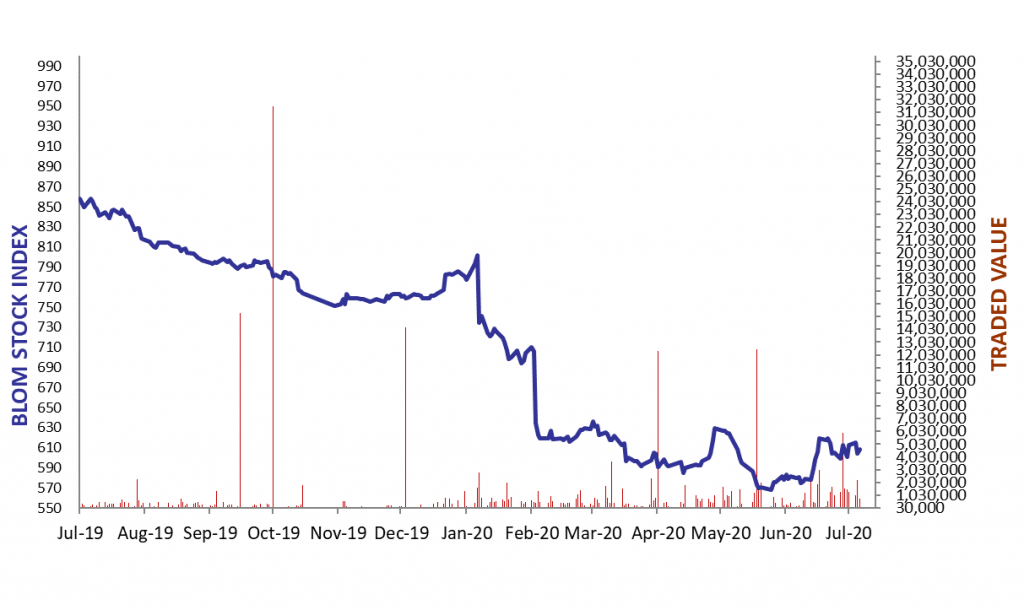
The BLOM Stock Index
Lebanese Global Depository Receipts: Last Session’s Performance
| Global Depository Receipts (GDRs) |
Last Price ($) |
Previous Price ($) |
% Change |
Volume |
Value ($) |
| BLOM GDR |
1.30 |
1.30 |
0.00% |
|
|
| Audi GDR |
0.41 |
0.41 |
0.00% |
1,612 |
661 |
| Byblos GDR |
70 |
70 |
0.00% |
– |
– |
Closing Date: July 6, 2020
Source: London Stock Exchange
BLOM BOND INDEX: Last Session’s Performance
| |
Last |
Previous |
Change |
Y-t-D Change |
| BBI |
16.01 |
16.08 |
-0.41% |
|
-68.33% |
| Weighted Yield |
63.25% |
62.99% |
26 |
bps |
|
| Duration (Years) |
2.74 |
2.75 |
|
|
|
| 5Y Bond Yield |
109.50% |
108.50% |
100 |
bps |
|
| 5Y Spread* |
10,934 |
10,834 |
100 |
bps |
|
| 10Y Bond Yield |
50.60% |
49.70% |
90 |
bps |
|
| 10Y Spread* |
5,030 |
4,941 |
89 |
bps |
|
*spread between Lebanese Eurobonds and US Treasuries
Closing Date: July 08, 2020
Lebanese Eurobonds: Last Sessions’ Prices and Yields
|
Price |
Yield |
Yield Change |
| 10/4/2022 |
17.75 |
113.94% |
14 |
| 1/27/2023 |
16.75 |
104.29% |
200 |
| 4/22/2024 |
16.88 |
75.07% |
4 |
| 11/4/2024 |
17.20 |
65.64% |
3 |
| 12/3/2024 |
16.25 |
70.22% |
51 |
| 2/26/2025 |
17.05 |
62.59% |
3 |
| 6/12/2025 |
17.70 |
58.64% |
2 |
| 11/28/2026 |
16.85 |
52.73% |
1 |
| 3/23/2027 |
16.63 |
52.81% |
1 |
| 11/29/2027 |
16.42 |
50.48% |
97 |
| 11/3/2028 |
16.85 |
46.53% |
1 |
| 2/26/2030 |
16.38 |
45.10% |
1 |
| 4/22/2031 |
16.48 |
45.12% |
0 |
| 3/23/2032 |
16.78 |
43.66% |
0 |
| 11/2/2035 |
17.13 |
41.60% |
(0) |
| 3/23/2037 |
17.25 |
42.16% |
0 |
Lebanese Forex Market
| |
Last Price |
Previous |
% Change |
Y-t-D |
| $/LBP |
1,514.25 |
1,514.25 |
– |
|
| €/LBP |
1,709.35 |
1,706.19 |
0.19% |
|
| £/LBP |
1,905.63 |
1,905.48 |
0.01% |
|
| NEER |
128.52 |
128.89 |
-0.29% |
|
Closing Date: July 9, 2020