Daily Capital Markets’ Performance
Discover today’s performance of BLOM indices, the closing prices of Lebanese stocks and Eurobonds, as well as the exchange rate of major currencies against the LBP.
BLOM Stock Index (BSI): Today’s Performance
| Last | Previous | % Change | Y-t-D Change | |
| BSI | 1,218.97 | 1,219.04 | -0.01% | 4.23% |
| High | 1,220.28 | 1,222.98 | ||
| Low | 1,215.80 | 1,215.18 | ||
| Volume | 987,895 | 262,816 | 275.89% | |
| Val ($) | 4,229,237 | 3,085,596 | 37.06% |
BLOM Preferred Shares Index (BPSI): Today’s Performance
| Last | Previous | Change | |
| BPSI | 104.92 | 104.99 | -0.07% |
| Volume | 18,565 | 26,600 | |
| Value | 1,881,517 | 710,600 |
Lebanese Stocks: Today’s Trades and Closing Prices
| ` | Last Price ($) | % Change | Volume | VWAP ($) |
| Solidere A |
11.45 |
-0.69% | 17,711 |
11.41 |
| Solidere B |
11.40 |
-0.52% | 4,500 |
11.40 |
| BLC Pref B |
100.00 |
– | 200 |
100.00 |
| BLC Pref C |
100.00 |
– | 400 |
100.00 |
| Audi (C) |
6.50 |
– | 26,600 |
6.50 |
| Audi Pref F |
101.00 |
– | 4,365 |
101.00 |
| Audi Pref G |
101.90 |
-0.10% | 4,500 |
101.94 |
| Audi Pref H |
101.10 |
0.10% | 4,500 |
101.10 |
| BYBLOS |
101.20 |
1.21% | 875,000 |
1.67 |
| Byblos Pref 09 |
101.50 |
-0.49% | 4,600 |
101.51 |
| BLOM Listed |
10.11 |
0.60% | 45,495 |
10.11 |
| BLOM (GDR) |
10.60 |
-0.93% | 24 |
10.60 |
| BLC Pref D |
100.00 |
– | – |
– |
| Audi (GDR) |
6.60 |
– | – |
– |
| BoB Pref I |
26.25 |
– | – |
– |
| BOB Preferred K |
25.25 |
– | – |
– |
| HOLCIM Liban |
13.87 |
– | – |
– |
| BLOM Pref 2011 |
10.00 |
– | – |
– |
| Byblos Pref 08 |
101.20 |
– | – |
– |
| CB (B) |
2.72 |
– | – |
– |
| BEMO (C) |
1.60 |
– | – |
– |
| BEMO PREF 13 |
100.00 |
– | – |
– |
| BLC (C) |
2.77 |
– | – |
– |
| BoB (C) |
18.80 |
– | – |
– |
| BOB Pref H |
26.25 |
– | – |
– |
| BOB Preferred J |
26.25 |
– | – |
– |
| BoB Priority 2014 |
21.00 |
– | – |
– |
| CB (N) |
1.57 |
– | – |
– |
| RYMCO |
3.25 |
– | – |
– |
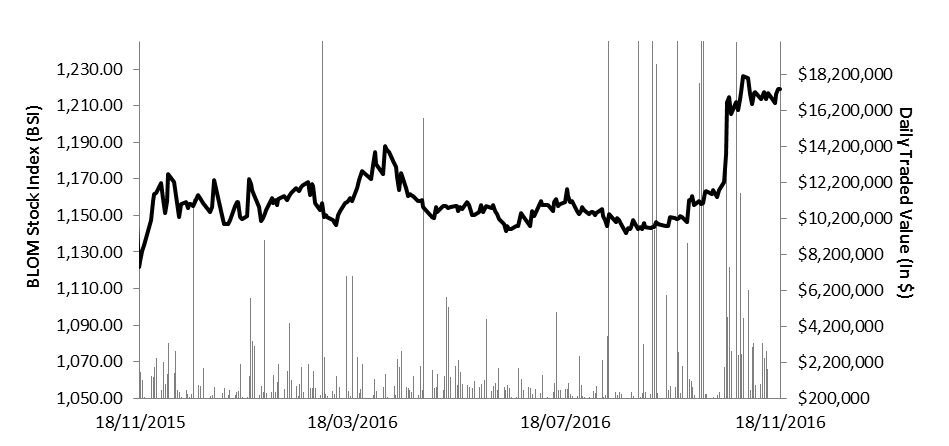
The BLOM Stock Index 52-WEEK TREND
Lebanese Global Depository Receipts: Last session’s Performance
| GDRs | Last Price ($) | Previous Price ($) | % Change | Volume | Value ($) |
| BLOM GDR | 10.60 | 10.60 | – | – | – |
| Audi GDR | 6.65 | 6.65 | – | – | – |
| Byblos GDR | 79.00 | 79.00 | – | – | – |
| Solidere GDR | 11.10 | 11.10 | – | 45,920 | 509,712 |
Source: Reuters
Closing Date: 17 November 2016
BLOM BOND INDEX: Last Session’s Performance
| Last | Previous | Change | Y-t-D Change | ||
| BBI | 100.89 | 100.89 | 0.00% | -3.10% | |
| Weighted Yield | 6.88% | 6.88% | 0 | bps | |
| Duration (Years) | 5.11 | 5.11 | |||
| 5Y Bond Yield | 6.74% | 6.75% | -1 | bps | |
| 5Y Spread* | 501 | 507 | -6 | bps | |
| 10Y Bond Yield | 7.32% | 7.32% | 0 | bps | |
| 10Y Spread* | 503 | 510 | -7 | bps | |
*between Lebanese Eurobonds and US Treasuries
Closing Date: 17 November 2016
Lebanese Eurobonds: Last Sessions’ Prices and Yields
| day/month/year | Price | Yield | Yield Change |
| 12/06/2018 | 98.5 | 6.16% | 0 |
| 12/11/2018 | 98 | 6.23% | 0 |
| 23/04/2019 | 98.13 | 6.34% | 0 |
| 20/05/2019 | 99.13 | 6.38% | 0 |
| 28/11/2019 | 97.38 | 6.41% | 0 |
| 09/03/2020 | 99.63 | 6.50% | 0 |
| 14/04/2020 | 97.88 | 6.50% | 0 |
| 19/06/2020 | 98.75 | 6.54% | 0 |
| 12/04/2021 | 105.75 | 6.72% | 0 |
| 04/10/2022 | 96.25 | 6.88% | 0 |
| 27/01/2023 | 95.38 | 6.93% | 0 |
| 04/11/2024 | 97.38 | 7.11% | 0 |
| 22/04/2024 | 94.63 | 7.15% | 0 |
| 03/12/2024 | 99 | 7.16% | 0 |
| 26/02/2025 | 93.75 | 7.21% | 0 |
| 12/06/2025 | 93.75 | 7.24% | 0 |
| 28/11/2026 | 94.75 | 7.35% | 0 |
| 29/11/2027 | 95.25 | 7.39% | 0 |
| 03/11/2028 | 94 | 7.41% | 0 |
| 26/02/2030 | 93.5 | 7.43% | 0 |
| 22/04/2031 | 96 | 7.46% | 0 |
| 02/11/2035 | 95.63 | 7.48% | 0 |
| Last Price | Previous | % Change | Y-t-D | |
| $/LBP | 1,514.00 | 1,514.25 | -0.02% | |
| €/LBP | 1,600.51 | 1,601.72 | -0.08% | |
| £/LBP | 1,863.87 | 1,871.56 | -0.41% | |
| NEER | 118.28 | 117.75 | 0.45% | 8.13% |
Closing Date: 18 November