Lebanon’s Cumulative Trade Deficit Up by 22.84% YoY to $17.44B by December 2025
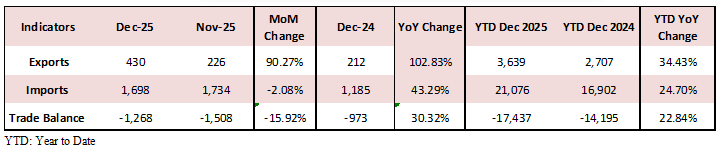
According to the Lebanese Customs Administration, Lebanon’s cumulative trade deficit increased by 22.84% year-over-year (YoY), to reach $17.44B by December 2025. This change was driven by a cumulative 24.70% YoY ($21,076 million) surge in imports by December 2025 despite a 34.43% YoY ($3,639 million) rise in exports during the same period.
The increase of Lebanon’s trade deficit is largely reflecting the impact of persistent regional and geopolitical pressures. Ongoing tensions along the southern border continued to disrupt economic activity and logistics, weighing on trade flows and investor confidence. At the same time, shifting regional dynamics – including relatively stronger trade movement through neighboring Syria and alternative transit routes – reduced Lebanon’s traditional role as a regional trade and re-export hub. Continued political uncertainty and the absence of structural economic reforms further constrained productive sectors and external competitiveness. Together, these factors deepened Lebanon’s external imbalance and contributed to the significant widening of the trade deficit by the end of 2025.
Lebanon’s Balance of Trade (USD Million)
Top Import Destinations for Lebanon in 2025
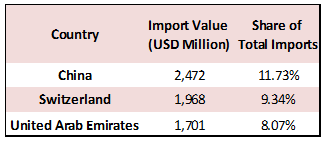
The top three import destinations in 2025 were China, Switzerland, and United Arab Emirates accounting for 11.73%, 9.34%, and 8.07% of the total value of imports, respectively. The top imported products were mineral products (22.94%) at $4,834 million, pearls, precious stones, and metals (18.77%) at $3,957 million, and products of the chemical or allied industries (8.06%) at $1,699 million.
Top Export Destinations for Lebanon in 2025
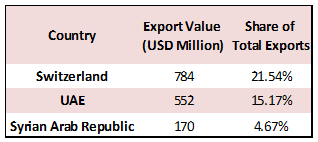
On the exports side, the top three destinations in 2025 were Switzerland, United Arab Emirates (UAE) and Syrian Arab Republic capturing respective shares of 21.54%, 15.17% and 4.67% of the total value of exports. The top exported products were pearls, precious stones, and metals (34.30%) at $1,248 million, base metals and articles of base metal (14.56%) at $530 million, and prepared foodstuffs, beverages, and tobacco (12.26%) at $446 million.
Disclaimer:
This article is a research document that is owned and published by BLOMINVEST BANK SAL.
No material from this publication may be modified, copied, reproduced, repackaged, republished, circulated, transmitted or redistributed directly or indirectly, in whole or in any part, without the prior written authorization of BLOMINVEST BANK SAL.
The information and opinions contained in this document have been compiled from or arrived at in good faith from sources deemed reliable. Neither BLOMINVEST BANK SAL, nor any of its subsidiaries or affiliates or parent company will make any representation or warranty to the accuracy or completeness of the information contained herein.
Neither the information nor any opinion expressed in this research article constitutes an offer or a recommendation to buy or sell any assets or securities, or to provide investment advice.This research article is prepared for general circulation and is circulated for general information only


