Lebanon’s Cumulative Trade Deficit Up by 50.86% YoY to $3.33B by February 2026
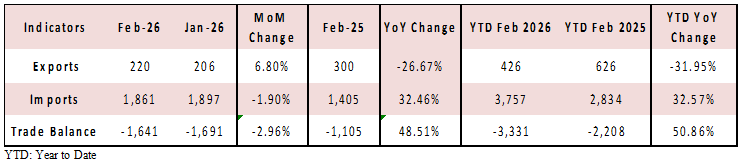
According to the Lebanese Customs Administration, Lebanon’s cumulative trade deficit increased by 50.86% year-over-year (YoY), to reach $3.33B by February 2026. This change was driven by a cumulative 32.57% YoY ($3,757 million) surge in imports by February 2026 and a 31.95% YoY ($426 million) fall in exports during the same period.
The increase of Lebanon’s trade deficit is largely reflecting the escalation of regional and geopolitical tensions. The outbreak of conflict between Israel and Hezbollah along Lebanon’s southern border in late February intensified disruptions to economic activity and trade logistics, further weakening confidence and external flows. At the same time, evolving regional dynamics – including stronger trade movement through neighboring Syria and the diversion of transit routes – continued to erode Lebanon’s role as a key trade hub. Ongoing political uncertainty and delayed reforms also limited the economy’s ability to adjust to these shocks. Together, these factors significantly deepened Lebanon’s external imbalance at the start of 2026.
Lebanon’s Balance of Trade (USD Million)
Top Import Destinations for Lebanon (YTD up to February 2026)
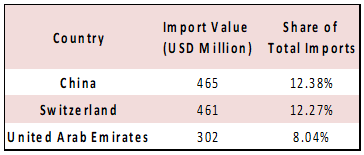
The top three import destinations by February 2026 were China, Switzerland, and United Arab Emirates accounting for 12.38%, 12.27%, and 8.04% of the total value of imports, respectively. The top imported products were Pearls, precious stones and metals (22.28%) at $837 million, Mineral products (21.29%) at $800 million, and Machinery; electrical instruments (9.29%) at $349 million.
Top Export Destinations for Lebanon (YTD up to February 2026)
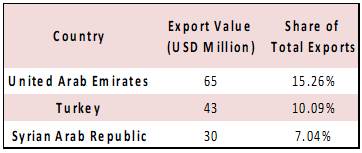
On the exports side, the top three destinations in 2025 were United Arab Emirates, Turkey, and Syrian Arab Republic capturing respective shares of 15.26%, 10.09% and 7.04% of the total value of exports. The top exported products were Pearls, precious stones and metals (19.95%) at $85 million, Base metals and articles of base metal (17.84%) at $76 million, and Prepared foodstuffs, beverages, tobacco (15.02%) at $64 million.
Disclaimer:
This article is a research document that is owned and published by BLOMINVEST BANK SAL.
No material from this publication may be modified, copied, reproduced, repackaged, republished, circulated, transmitted or redistributed directly or indirectly, in whole or in any part, without the prior written authorization of BLOMINVEST BANK SAL.
The information and opinions contained in this document have been compiled from or arrived at in good faith from sources deemed reliable. Neither BLOMINVEST BANK SAL, nor any of its subsidiaries or affiliates or parent company will make any representation or warranty to the accuracy or completeness of the information contained herein.
Neither the information nor any opinion expressed in this research article constitutes an offer or a recommendation to buy or sell any assets or securities, or to provide investment advice.
This research article is prepared for general circulation and is circulated for general information only.