Discover today’s performance of BLOM indices, the closing prices of Lebanese stocks and Eurobonds, as well as the exchange rate of major currencies against the LBP.
BLOM Stock Index (BSI): Today’s Performance
| |
Last |
Previous |
% Change |
Y-t-D Change |
| BSI |
1,164.70 |
1,157.11 |
0.66% |
-0.41% |
| High |
1,164.70 |
1,158.57 |
|
|
| Low |
1,157.48 |
1,152.93 |
|
|
| Volume |
76,872 |
87,253 |
-11.90% |
|
| Val ($) |
729,656 |
725,185 |
0.62% |
|
BLOM Preferred Shares Index (BPSI): Today’s Performance
| |
Last |
Previous |
Change |
| BPSI |
104.24 |
104.26 |
-0.02% |
| Volume |
10,148 |
9,201 |
|
| Value |
116,670 |
383,980 |
|
Lebanese Stocks: Today’s Trades and Closing Prices
| Active Stocks |
Volume |
Value |
Closing Price |
% change |
| Solidere A |
15,314 |
151,806 |
10.00 |
2.99% |
| Solidere B |
14,814 |
145,115 |
9.80 |
3.48% |
| BLOM Bank – GDR |
17,200 |
173,204 |
10.07 |
0.00% |
| BLOM Bank |
5,887 |
59,105 |
10.04 |
0.90% |
| BLOM Bank – Pref 11 |
9,168 |
91,680 |
10.00 |
-0.20% |
| Bank Audi |
13,797 |
85,541 |
6.20 |
0.00% |
| Bank of Beirut Pref. Class J |
980 |
24,990 |
25.50 |
0.00% |
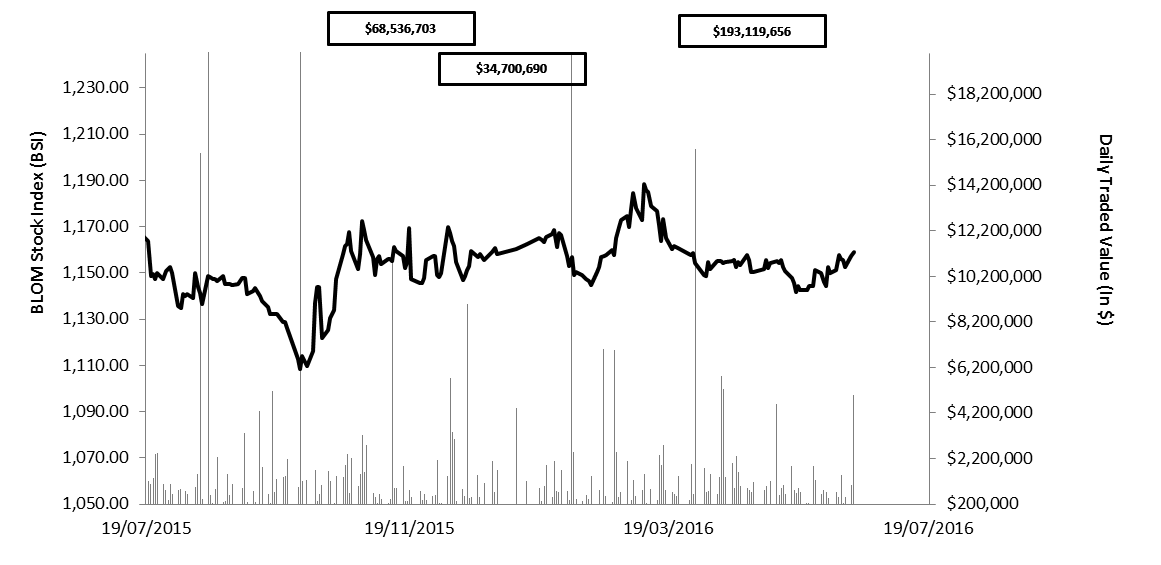
The BLOM Stock Index 52-WEEK TREND
Lebanese Global Depository Receipts: Last session’s Performance
| GDRs |
Last Price ($) |
Previous Price ($) |
% Change |
Volume |
Value ($) |
| BLOM GDR |
10.05 |
10.05 |
– |
8,200 |
82,410 |
| Audi GDR |
6.25 |
6.20 |
0.81% |
8,739 |
54,619 |
| Byblos GDR |
75.00 |
75.00 |
– |
– |
– |
| Solidere GDR |
9.70 |
9.70 |
– |
– |
– |
Source: Reuters Closing Date: 18 July 2016
BLOM BOND INDEX: Last Session’s Performance
| |
Last |
Previous |
Change |
Y-t-D Change |
| BBI |
103.43 |
103.39 |
0.04% |
-0.66% |
| Weighted Yield |
6.30% |
6.31% |
-1 |
bps |
|
| Duration (Years) |
5.20 |
5.21 |
|
|
|
| 5Y Bond Yield |
6.18% |
6.18% |
0 |
bps |
|
| 5Y Spread* |
533 |
531 |
2 |
bps |
|
| 10Y Bond Yield |
6.84% |
6.85% |
-1 |
bps |
|
| 10Y Spread* |
544 |
543 |
1 |
bps |
|
*between Lebanese Eurobonds and US Treasuries
Closing Date: 18 July 2016
Lebanese Eurobonds: Last Sessions’ Prices and Yields
| |
Price ($) |
Yield |
Yield Change (in bps) |
| Oct. 2017 |
99.63 |
5.31% |
0 |
| Jun. 2018 |
99.63 |
5.35% |
0 |
| Nov. 2018 |
99.38 |
5.43% |
0 |
| Apr. 2019 |
99.5 |
5.69% |
0 |
| May. 2019 |
100.75 |
5.71% |
0 |
| Nov.2019 |
99 |
5.78% |
0 |
| Mar. 2020 |
101.5 |
5.91% |
-4 |
| Apr. 2020 |
99.5 |
5.95% |
-4 |
| Apr. 2021 |
108.5 |
6.15% |
0 |
| Oct. 2022 |
98.88 |
6.32% |
0 |
| Jan. 2023 |
98 |
6.38% |
0 |
| Apr.2024 |
97 |
6.73% |
0 |
| Nov. 2024 |
99.88 |
6.67% |
0 |
| Dec. 2024 |
101.5 |
6.76% |
0 |
| Feb. 2025 |
96.25 |
6.78% |
0 |
| Jun. 2025 |
96.3 |
6.81% |
-1 |
| Nov. 2026 |
98.13 |
6.85% |
-2 |
| Nov. 2027 |
99 |
6.88% |
-3 |
| Nov. 2028 |
97.75 |
6.92% |
0 |
| Feb. 2030 |
97 |
6.99% |
0 |
| Apr. 2031 |
99.5 |
7.05% |
0 |
| Nov. 2035 |
99.13 |
7.13% |
-1 |
| |
Last Price |
Previous |
% Change |
Y-t-D |
| $/LBP |
1,514.00 |
1,514.00 |
– |
|
| €/LBP |
1,666.69 |
1,662.32 |
0.26% |
|
| £/LBP |
1,987.94 |
1,947.99 |
2.05% |
|
| NEER |
167.10 |
167.01 |
0.06% |
-0.76% |
Closing Date: 19 July