Discover today’s performance of BLOM indices, the closing prices of Lebanese stocks and Eurobonds, as well as the exchange rate of major currencies against the LBP.
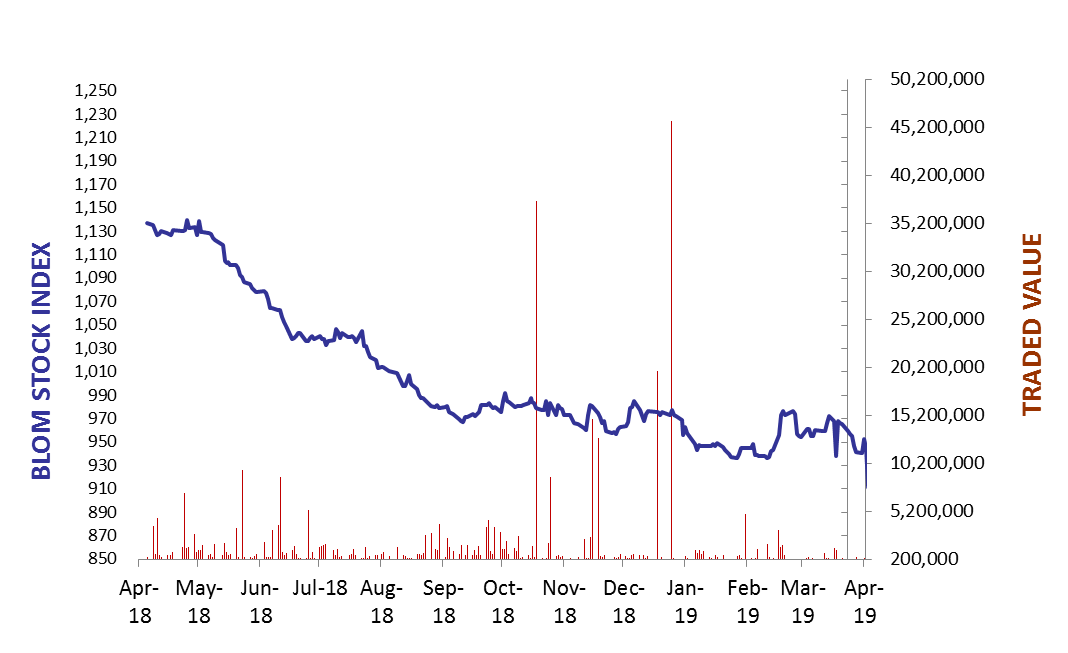
BLOM Stock Index (BSI) – today’s performance
| Last | Previous | % Change | Y-t-D Change | |
| BSI | 896.31 | 911.76 | -1.69% | -6.66% |
| High | 896.40 | 944.60 | ||
| Low | 894.90 | 911.50 | ` | |
| Volume | 89,042 | 35,814 | ||
| Val ($) | 364,542 | 201,967 |
I): Today’s Performance:
BLOM preferred Shares Index (BPSI): today’s Performance
| Last | Previous | Change | |
| BPSI | 87.36 | 87.36 | 0.00% |
| Volume | |||
| Value |
Lebanese Stocks: today’s Trades and Closing Prices
| Last Price ($) | % Change | Volume | VWAP ($) | |
| Solidere A | 5.42 | 2.46% | 6,925 | 5.36 |
| Solidere B | 5.3 | 8.61% | 8,617 | 5.28 |
| Bank Audi | 4.65 | -5.10% | 1,400 | 4.65 |
| Bank Audi GDR | 4.23 | -3.86% | 53,000 | 4.23 |
| Byblos Bank – Listed Shares | 1.23 | -9.56% | 15,000 | 1.23 |
| BLOM GDR | 7.99 | 50.00% | 4,100 | 7.99 |
The BLOM Stock Index
Lebanese Global Depository Receipts: Last session’s Performance
| GDRs | Last Price ($) | Previous Price ($) | % Change | Volume | Value ($) |
| BLOM GDR | 7.9 | 8.85 | -10.73% | 29,159 | 228,956 |
| Audi GDR | 5.05 | 5.05 | 0.00% | – | – |
| Byblos GDR | 77 | 77 | 0.00% | – | – |
Closing Date: 18 April 2019
Source: London Stock Exchange
BLOM BOND INDEX: Last Session’s Performance
| Last | Previous | Change | Y-t-D Change | ||
| BBI | 92.39 | 92.72 | -0.353% | -8.58% | |
| Weighted Yield | 9.83% | 9.73% | 10 | bps | |
| Duration (Years) | 4.73 | 4.74 | |||
| 5Y Bond Yield | 10.12% | 9.88% | 24 | bps | |
| 5Y Spread* | 776 | 750 | 26 | bps | |
| 10Y Bond Yield | 9.97% | 9.82% | 15 | bps | |
| 10Y Spread* | 751 | 732 | 19 | bps | |
*between Lebanese Eurobonds and US Treasuries
Closing Date: 18 April 2019
Lebanese Eurobonds: Last Sessions’ Prices and Yields
| Price | Yield | Yield Change | |
| 09/03/2020 | 97.59 | 9.24% | 20 |
| 14/04/2020 | 96.52 | 9.58% | 33 |
| 19/06/2020 | 96.26 | 9.61% | 24 |
| 12/04/2021 | 96.48 | 10.26% | 6 |
| 04/10/2022 | 88.70 | 10.05% | 15 |
| 27/01/2023 | 87.26 | 10.15% | 14 |
| 22/04/2024 | 86.29 | 10.23% | 7 |
| 04/11/2024 | 84.25 | 10.04% | 6 |
| 03/12/2024 | 86.30 | 10.30% | 2 |
| 26/02/2025 | 84.29 | 9.80% | 5 |
| 12/06/2025 | 84.94 | 9.55% | 3 |
| 28/11/2026 | 82.93 | 9.84% | 9 |
| 23/03/2027 | 82.92 | 10.03% | 12 |
| 29/11/2027 | 81.82 | 9.95% | 13 |
| 03/11/2028 | 81.60 | 9.66% | 6 |
| 26/02/2030 | 80.11 | 9.65% | 4 |
| 22/04/2031 | 79.45 | 10.01% | 5 |
| 23/03/2032 | 81.36 | 9.55% | 4 |
| 02/11/2035 | 79.98 | 9.48% | 4 |
| 23/03/2037 | 80.21 | 9.59% | 6 |
Lebanese Forex Market
| Last Price | Previous | % Change | Y-t-D | |
| $/LBP | 1,514.25 | 1,514.25 | – | |
| €/LBP | 1,687.65 | 1,696.69 | -0.53% | |
| £/LBP | 1,949.95 | 1,957.04 | -0.36% | |
| NEER | 118.86 | 118.52 | 0.29% |
Closing Date: 23 April 2019