
Discover today’s performance of BLOM indices, the closing prices of Lebanese stocks and Eurobonds, as well as the exchange rate of major currencies against the LBP.
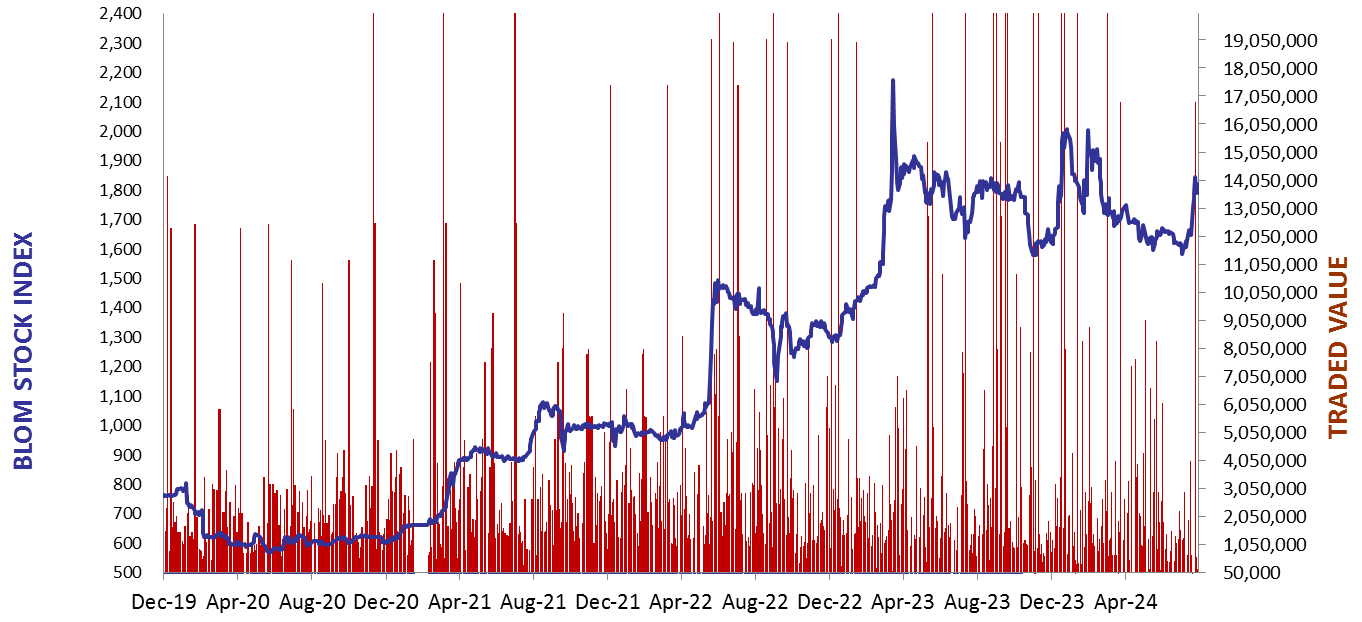
BLOM Stock Index (BSI) – today’s performance
| Last | Previous | % Change | Y-t-D Change | |
| BSI | 2,025.01 | 2,010.73 | 0.71% | 2.64% |
| High | 2,026.98 | 2,020.42 | ||
| Low | 2,010.73 | 1,998.69 | ||
| Volume | 5,143 | 21,187 | ||
| Val ($) | 440,710 | 980,752 |
I): BLOM preferred Shares Index (BPSI): today’s Performance
| Last | Previous | Change | |
| BPSI | 27.78 | 27.78 | 0.00% |
| Volume | |||
| Value |
Lebanese Stocks: today’s Trades and Closing Prices
| Last Price ($) | % Change | Volume | VWAP ($) | |
| Solidere B | 86.15 | 0.17% | 5,000 | 86.14 |
| HOLCIM | 70.00 | 11.11% | 143 | 70.00 |
Closing Date: September 23, 2024
The BLOM Stock Index
BLOM BOND INDEX: Last Session’s Performance
| Last | Previous | Change | Y-t-D Change | ||
| BBI | 5.38 | 5.44 | -1.07% | -10.76% | |
| Weighted Yield | 232.45% | 229.58% | 287 | bps | |
| Duration (Years) | 1.23 | 1.24 | |||
| 5Y Bond Yield | 110.10% | 109.60% | 50 | bps | |
| 5Y Spread* | 10,618 | 10,567 | 51 | bps | |
| 10Y Bond Yield | 108.40% | 106.20% | 220 | bps | |
| 10Y Spread* | 10,494 | 10,273 | 221 | bps |
*spread between Lebanese Eurobonds and US Treasuries
| Price | Yield | Yield Change | |
| 12/06/2025 | 6.54 | 1081.83% | 2,021 |
| 28/11/2026 | 6.50 | 219.54% | 104 |
| 23/03/2027 | 6.40 | 199.81% | 259 |
| 29/11/2027 | 6.39 | 157.63% | 205 |
| 03/11/2028 | 6.50 | 129.88% | 42 |
| 26/02/2030 | 6.51 | 113.18% | 24 |
| 22/04/2031 | 6.50 | 110.53% | 53 |
| 23/03/2032 | 6.50 | 109.69% | 85 |
| 02/11/2035 | 6.40 | 107.84% | 236 |
| 23/03/2037 | 6.50 | 111.32% | 45 |
Closing Date: September 20, 2024
Lebanese Forex Market
| Last Price | Previous | % Change | |
| $/LBP | 89,500 | 89,500 | – |
| €/LBP | 99,908.85 | 99,899.90 | 0.01% |
| £/LBP | 119,169.25 | 119,222.95 | -0.05% |
| NEER | 229.94 | 229.87 | 0.03% |
Closing Date: September 23, 2024