
Discover today’s performance of BLOM indices, the closing prices of Lebanese stocks and Eurobonds, as well as the exchange rate of major currencies against the LBP.
BLOM Stock Index (BSI) – today’s performance
| Last | Previous | % Change | Y-t-D Change | |
| BSI | 2,087.41 | 2,025.01 | 3.08% | 5.80% |
| High | 2,095.62 | 2,026.98 | ||
| Low | 2,079.13 | 2,010.73 | ||
| Volume | 19,050 | 5,143 | ||
| Val ($) | 1,722,727 | 440,710 |
I): BLOM preferred Shares Index (BPSI): today’s Performance
| Last | Previous | Change | |
| BPSI | 27.78 | 27.78 | 0.00% |
| Volume | |||
| Value |
Lebanese Stocks: today’s Trades and Closing Prices
| Last Price ($) | % Change | Volume | VWAP ($) | |
| Solidere A | 91.60 | 4.09% | 14,187 | 90.47 |
| Solidere B | 90.45 | 4.99% | 4,863 | 90.33 |
Closing Date: September 24, 2024
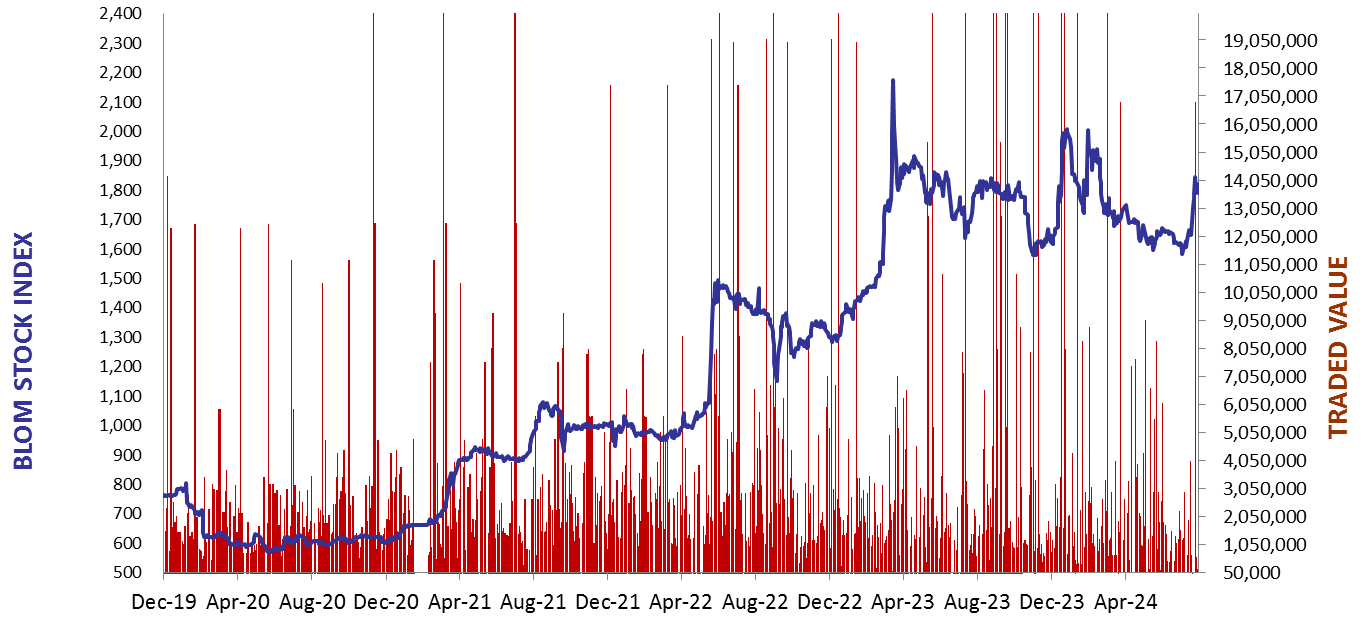
The BLOM Stock Index
BLOM BOND INDEX: Last Session’s Performance
| Last | Previous | Change | Y-t-D Change | ||
| BBI | 5.34 | 5.38 | -0.78% | -11.46% | |
| Weighted Yield | 236.25% | 232.45% | 379 | bps | |
| Duration (Years) | 1.39 | 1.23 | |||
| 5Y Bond Yield | 110.80% | 110.10% | 70 | bps | |
| 5Y Spread* | 10,689 | 10,618 | 71 | bps | |
| 10Y Bond Yield | 108.30% | 108.20% | 10 | bps | |
| 10Y Spread* | 10,483 | 10,474 | 9 | bps |
*spread between Lebanese Eurobonds and US Treasuries
| Price | Yield | Yield Change | |
| 12/06/2025 | 6.51 | 1111.34% | 2,951 |
| 28/11/2026 | 6.38 | 222.87% | 333 |
| 23/03/2027 | 6.35 | 201.73% | 192 |
| 29/11/2027 | 6.37 | 158.32% | 70 |
| 03/11/2028 | 6.38 | 131.67% | 180 |
| 26/02/2030 | 6.49 | 113.43% | 24 |
| 22/04/2031 | 6.44 | 111.56% | 103 |
| 23/03/2032 | 6.50 | 109.91% | 22 |
| 02/11/2035 | 6.41 | 107.90% | 6 |
| 23/03/2037 | 6.43 | 112.74% | 142 |
Closing Date: September 23, 2024
Lebanese Forex Market
| Last Price | Previous | % Change | |
| $/LBP | 89,500 | 89,500 | – |
| €/LBP | 100,061 | 99,452.4 | 0.61% |
| £/LBP | 120,037.4 | 119,446.7 | 0.49% |
| NEER | 229.99 | 229.57 | 0.18% |
Closing Date: September 24, 2024