
Discover today’s performance of BLOM indices, the closing prices of Lebanese stocks and Eurobonds, as well as the exchange rate of major currencies against the LBP.
BLOM Stock Index (BSI) – today’s performance
| Last | Previous | % Change | Y-t-D Change | |
| BSI | 2,033.70 | 2,087.41 | -2.57% | 3.08% |
| High | 2,046.43 | 2,095.62 | ||
| Low | 2,026.13 | 2,079.13 | ||
| Volume | 19,859 | 19,050 | ||
| Val ($) | 1,760,055 | 1,722,727 |
I): BLOM preferred Shares Index (BPSI): today’s Performance
| Last | Previous | Change | |
| BPSI | 27.78 | 27.78 | 0.00% |
| Volume | |||
| Value |
Lebanese Stocks: today’s Trades and Closing Prices
| Last Price ($) | % Change | Volume | VWAP ($) | |
| Solidere A | 89.35 | -2.46% | 16,775 | 88.96 |
| Solidere B | 87.50 | -3.26% | 3,000 | 87.50 |
| HOLCIM | 63.15 | -9.79% | 84 | 63.20 |
Closing Date: September 25, 2024
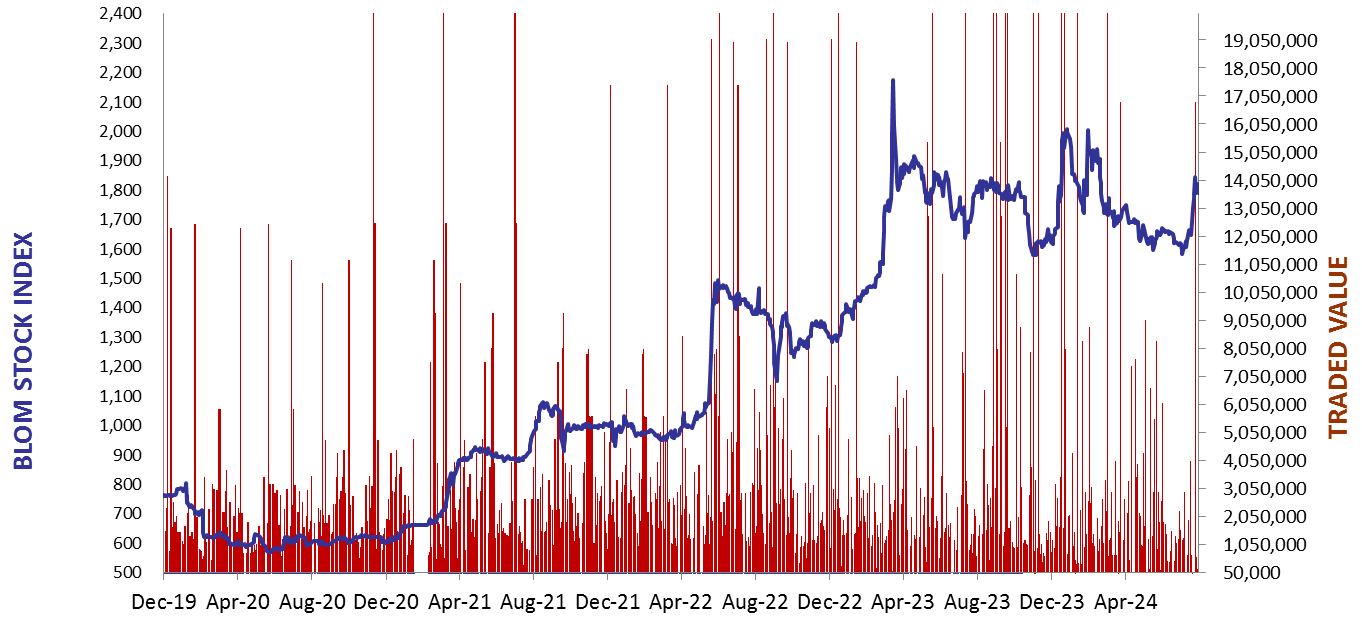
The BLOM Stock Index
BLOM BOND INDEX: Last Session’s Performance
| Last | Previous | Change | Y-t-D Change | ||
| BBI | 5.30 | 5.34 | -0.82% | -12.19% | |
| Weighted Yield | 238.37% | 236.25% | 213 | bps | |
| Duration (Years) | 1.38 | 1.39 | |||
| 5Y Bond Yield | 112.80% | 110.80% | 200 | bps | |
| 5Y Spread* | 10,892 | 10,689 | 203 | bps | |
| 10Y Bond Yield | 109.90% | 108.30% | 160 | bps | |
| 10Y Spread* | 10,646 | 10,483 | 163 | bps |
*spread between Lebanese Eurobonds and US Treasuries
| Price | Yield | Yield Change | |
| 12/06/2025 | 6.46 | 1125.32% | 1,398 |
| 28/11/2026 | 6.32 | 224.34% | 147 |
| 23/03/2027 | 6.29 | 203.05% | 132 |
| 29/11/2027 | 6.29 | 159.63% | 130 |
| 03/11/2028 | 6.29 | 132.95% | 127 |
| 26/02/2030 | 6.50 | 113.31% | (12) |
| 22/04/2031 | 6.28 | 114.05% | 249 |
| 23/03/2032 | 6.50 | 109.86% | (6) |
| 02/11/2035 | 6.29 | 109.92% | 201 |
| 23/03/2037 | 6.38 | 113.67% | 93 |
Closing Date: September 24, 2024
Lebanese Forex Market
| Last Price | Previous | % Change | |
| $/LBP | 89,500 | 89,500 | – |
| €/LBP | 100,141.55 | 100,061.00 | 0.08% |
| £/LBP | 119,759.95 | 120,037.40 | -0.23% |
| NEER | 229.70 | 229.99 | -0.12% |
Closing Date: September 25, 2024