
Discover today’s performance of BLOM indices, the closing prices of Lebanese stocks and Eurobonds, as well as the exchange rate of major currencies against the LBP.
BLOM Stock Index (BSI) – today’s performance
| Last | Previous | % Change | Y-t-D Change | |
| BSI | 2,144.58 | 2,172.80 | -1.30% | 8.70% |
| High | 2,172.80 | 2,186.29 | ||
| Low | 2,123.69 | 2,159.83 | ||
| Volume | 214,314 | 35,983 | ||
| Val ($) | 20,360,970 | 1,619,921 |
I): BLOM preferred Shares Index (BPSI): today’s Performance
| Last | Previous | Change | |
| BPSI | 27.78 | 27.78 | 0.00% |
| Volume | |||
| Value |
Lebanese Stocks: today’s Trades and Closing Prices
| Last Price ($) | % Change | Volume | VWAP ($) | |
| Solidere A | 95.00 | -2.01% | 154,739 | 95.01 |
| Solidere B | 95.00 | -1.50% | 59,575 | 95.00 |
Closing Date: November 4, 2024
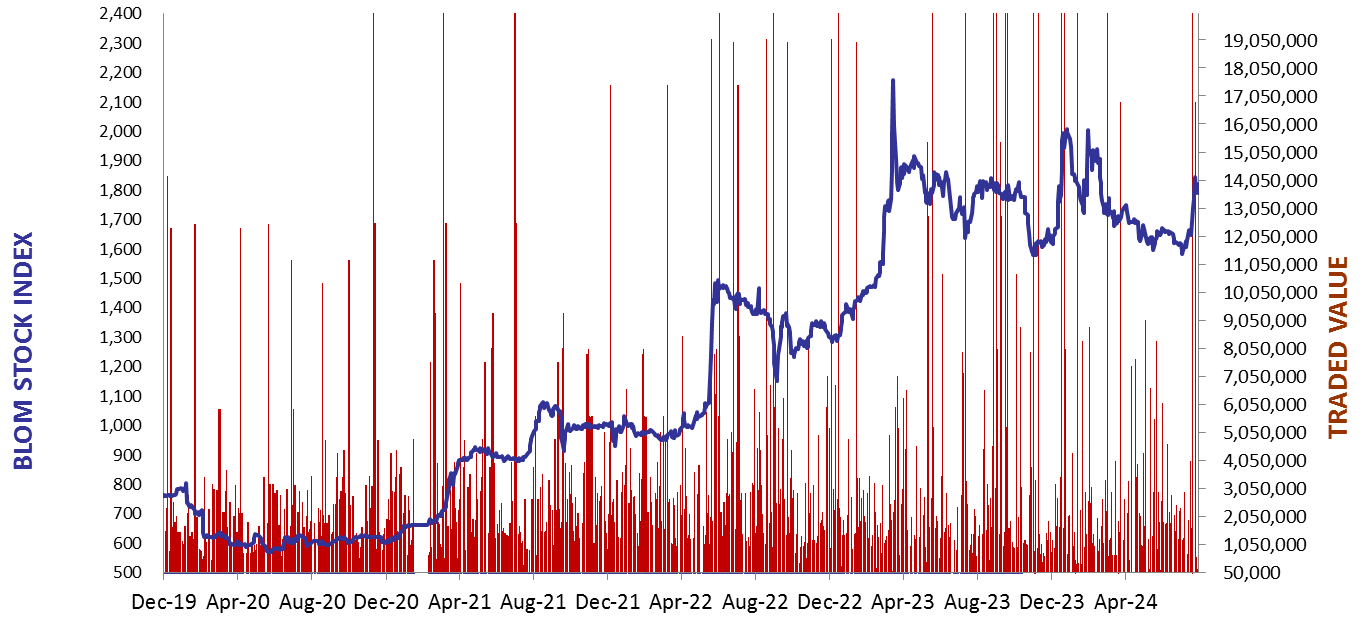
The BLOM Stock Index
BLOM BOND INDEX: Last Session’s Performance
| Last | Previous | Change | Y-t-D Change | ||
| BBI | 7.01 | 7.00 | 0.16% | 16.26% | |
| Weighted Yield | 228.84% | 229.23% | -38 | bps | |
| Duration (Years) | 1.52 | 1.52 | |||
| 5Y Bond Yield | 89.40% | 90.00% | -60 | bps | |
| 5Y Spread* | 8,512 | 8,573 | -61 | bps | |
| 10Y Bond Yield | 85.20% | 85.00% | 20 | bps | |
| 10Y Spread* | 8,102 | 8,088 | 14 | bps |
*spread between Lebanese Eurobonds and US Treasuries
| Price | Yield | Yield Change | |
| 12/06/2025 | 8.58 | 1257.25% | (305) |
| 28/11/2026 | 8.47 | 201.68% | (30) |
| 23/03/2027 | 8.37 | 176.33% | (1) |
| 29/11/2027 | 8.42 | 139.12% | 0 |
| 03/11/2028 | 8.42 | 113.51% | 6 |
| 26/02/2030 | 8.45 | 94.16% | (25) |
| 22/04/2031 | 8.47 | 90.28% | (119) |
| 23/03/2032 | 8.34 | 87.36% | 15 |
| 02/11/2035 | 8.39 | 84.38% | 18 |
| 23/03/2037 | 8.45 | 84.93% | (20) |
Closing Date: November 1, 2024
Lebanese Forex Market
| Last Price | Previous | % Change | |
| $/LBP | 89,500 | 89,500 | – |
| €/LBP | 97,501.30 | 96,964.30 | 0.55% |
| £/LBP | 116,054.65 | 115,687.70 | 0.32% |
| NEER | 231.11 | 231.04 | 0.03% |
Closing Date: November 4, 2024