Does Lebanon Need a New Economic Model?
| Trillion LBP | 2018 | 2019 | 2020 | 2021 |
| GDP | 82.8 | 80.3 | 96.9 | 245.6 |
| Total Exports | 17.2 | 16.6 | 27.2 | 96.2 |
| Goods Exports | 5.5 | 7.0 | 16.4 | 53.1 |
| Service Exports | 11.7 | 9.6 | 10.8 | 43.1 |
| Total Imports | 39.3 | 33.9 | 57.2 | 212.5 |
| Goods Imports | 29.8 | 24.9 | 45.9 | 172.8 |
| Service Imports | 9.5 | 9.0 | 11.3 | 39.7 |
| % | ||||
| Goods Exports/
Service Exports |
47 | 73 | 152 | 123 |
| Goods Exports/
Goods Imports |
18 | 28 | 36 | 31 |
| Total Exports/
GDP |
21 | 21 | 28 | 39 |
| LBP | ||||
| Exchange Rate
per USD |
1,507.5 | 1,507.5 | 3,879.6 | 12,413.7 |
Source: CAS
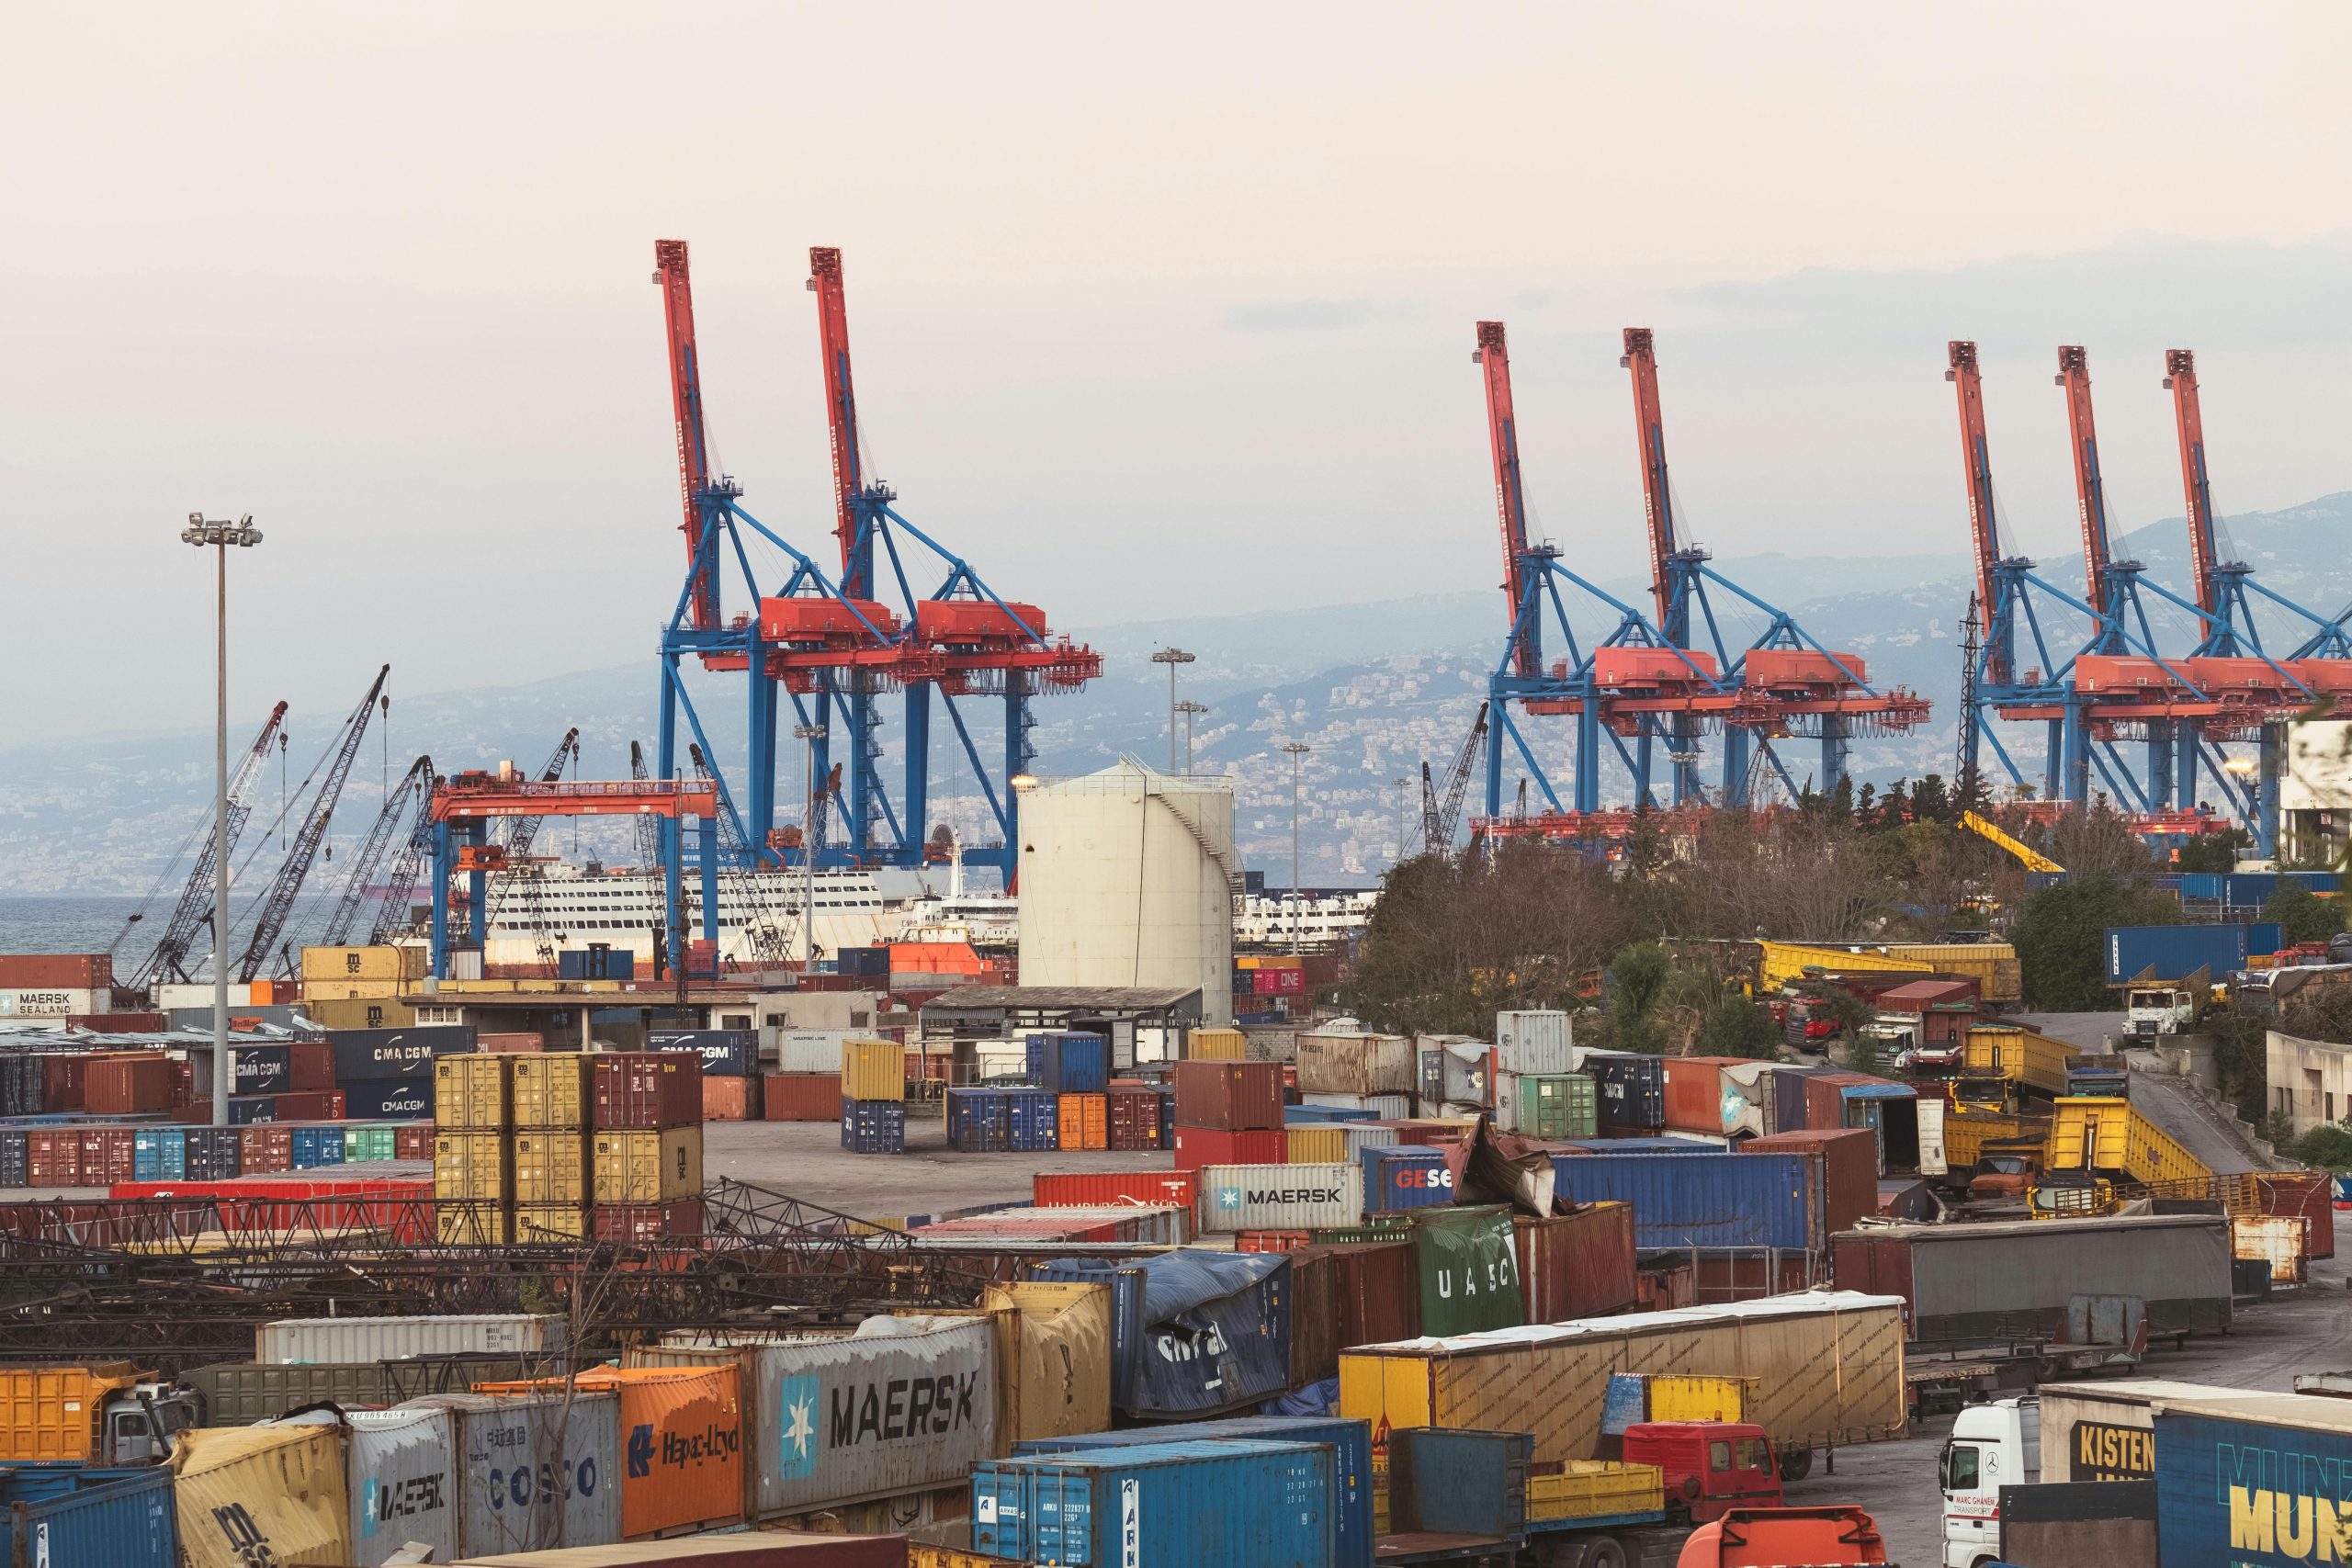
Being a small, open economy, Lebanon’s productivity and economic potential is perhaps best measured by its export capabilities and success. Traditionally, Lebanon’s export base is known to have centered on services – mostly: tourism and travel; finance; real estate; personal, cultural and recreation; and transport. But the financial crisis, which erupted in October 2019 and continues unabated, has damaged the confidence in this model and even accused it of being rentier or crony. There are thus insistent calls now for a new “economic model” that is centered largely on the export of goods, sustained by a wider industrial and technological base[1]. In this sense, the purpose of this short note is to assess the viability of such a transformation and whether the export- based model can be turned around towards goods and tech products[2].
[1] Among others, see: Tawile, J. “After the Crony: A New Competitive Model for Lebanon”, Konrad Adenauer Stiftung, November 2021; Bisat, A. and Diwan, I. “Towards a Productive New Lebanon”, Issam Fares Institute, AUB, March 2025.
[2] Keep in mind that in terms of structural transformation, the share of services in the economy is bound to increase over time. In 1973, the sectoral shares in the economy were as follows: 9.1% agriculture; 20.4% industry; and 70.5% services. Whereas in 2021, they were: 5.2% agriculture; 10.8% industry; and 80% services.
For the full report, click on the link below:


