Contrasting Demand for Lebanese Eurobonds’ on Wednesday
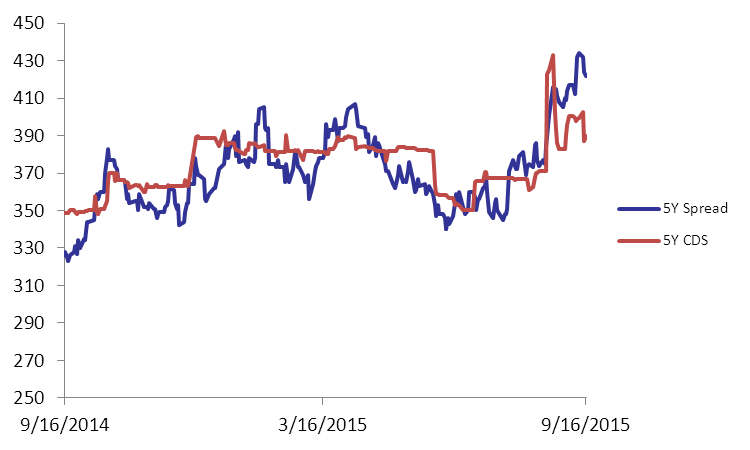
Even though demand was mixed, Lebanese Eurobonds saw improving activity on Wednesday, partially stirred by the demonstrations that occurred in the Downtown area. Medium-term notes showed an improvement yesterday that was offset by a loss in appetite for long-term maturities. Accordingly, the BLOM Bond Index (BBI) declined by 0.06% to 105.69 points, broadening its year-to-date loss to 1.66%. Yield on the 10Y Lebanese Eurobonds increased by 4 basis points (bps) to 6.35% while that of the 5Y fell by 1 bp to 5.84%. As demand for medium-term US notes weakened, the 5Y spread between both notes tightened by 2 bps to 422 bps. As for the Lebanese 5Y Credit Default Swaps (CDS), they broadened from their pervious quotes of 373-401 bps to 375-405 bps.
| Last | Previous | Change | Y-t-D Change | ||
| BBI | 105.690 | 105.755 | -0.061% | -1.66% | |
| Weighted Yield | 5.75% | 5.74% | 1 | bps | |
| Duration (Years) | 4.98 | 4.99 | |||
| 5Y Bond Yield | 5.84% | 5.85% | -1 | bps | |
| 5Y Spread* | 422 | 424 | -2 | bps | |
| 10Y Bond Yield | 6.35% | 6.31% | 4 | bps | |
| 10Y Spread* | 405 | 403 | 2 | bps | |
*Between Lebanese and U.S notes
| Price | Yield | Yield Change (in bps) | |
| Nov. 2016 | 100.59 | 4.20% | 0 |
| Mar. 2017 | 106.25 | 4.67% | -1 |
| Oct. 2017 | 100.38 | 4.80% | 0 |
| Jun. 2018 | 100.38 | 5.00% | 5 |
| Nov. 2018 | 100 | 5.15% | 9 |
| Apr. 2019 | 100.75 | 5.27% | 0 |
| May. 2019 | 102.25 | 5.32% | 0 |
| Nov.2019 | 99.88 | 5.48% | 3 |
| Mar. 2020 | 103 | 5.61% | 0 |
| Apr. 2020 | 100.63 | 5.64% | -3 |
| Apr. 2021 | 110.88 | 5.93% | -3 |
| Oct. 2022 | 100.38 | 6.03% | 6 |
| Jan. 2023 | 99.5 | 6.08% | 6 |
| Dec. 2024 | 105.13 | 6.26% | 7 |
| Feb. 2025 | 99.38 | 6.29% | 5 |
| Jun. 2025 | 99.38 | 6.33% | 5 |
| Nov. 2026 | 100.85 | 6.49% | -1 |
| Nov. 2027 | 101.63 | 6.55% | -2 |
| Feb. 2030 | 99.88 | 6.66% | -1 |