Discover today’s performance of BLOM indices, the closing prices of Lebanese stocks and Eurobonds, as well as the exchange rate of major currencies against the LBP.
BLOM Stock Index (BSI): Today’s Performance
| |
Last |
Previous |
%Change |
Y-t-D Change |
| BSI |
1,210.50 |
1,209.29 |
0.10% |
3.44% |
| High |
1,212.62 |
1,210.51 |
|
|
| Low |
1,210.34 |
1,208.60 |
|
|
| Volume |
256,870 |
241,214 |
6.49% |
|
| Val ($) |
1,181,397 |
1,032,615 |
14.41% |
|
BLOM Preferred Shares Index (BPSI): Today’s Performance
| |
Last |
Previous |
Change |
| BPSI |
105.39 |
105.45 |
-0.06% |
| Volume |
3,401 |
20,163 |
|
| Value |
282,853 |
202,646 |
|
Lebanese Stocks: Today’s Trades and Closing Prices
|
Last Price ($) |
% Change |
Volume |
VWAP ($) |
| Solidere A |
10.08 |
0.30% |
28,522 |
9.98 |
| Solidere B |
9.74 |
-1.32% |
827 |
9.76 |
| Byblos Bank Listed |
1.71 |
0.59% |
194,881 |
1.71 |
| Byblos Bank Preferred 2008 |
102.00 |
-0.58% |
1,000 |
102.00 |
| Byblos Bank Preferred 2009 |
102.60 |
0.10% |
1,693 |
102.60 |
| BLOM GDR |
11.20 |
0.72% |
10,000 |
11.20 |
| BLOM Pref 2011 |
10.10 |
0.50% |
708 |
10.10 |
| Holcim |
11.96 |
1.79% |
5,820 |
11.96 |
| Audi GDR |
6.88 |
0.00% |
13,079 |
6.88 |
| CB (B) |
3.25 |
0.00% |
340 |
3.25 |
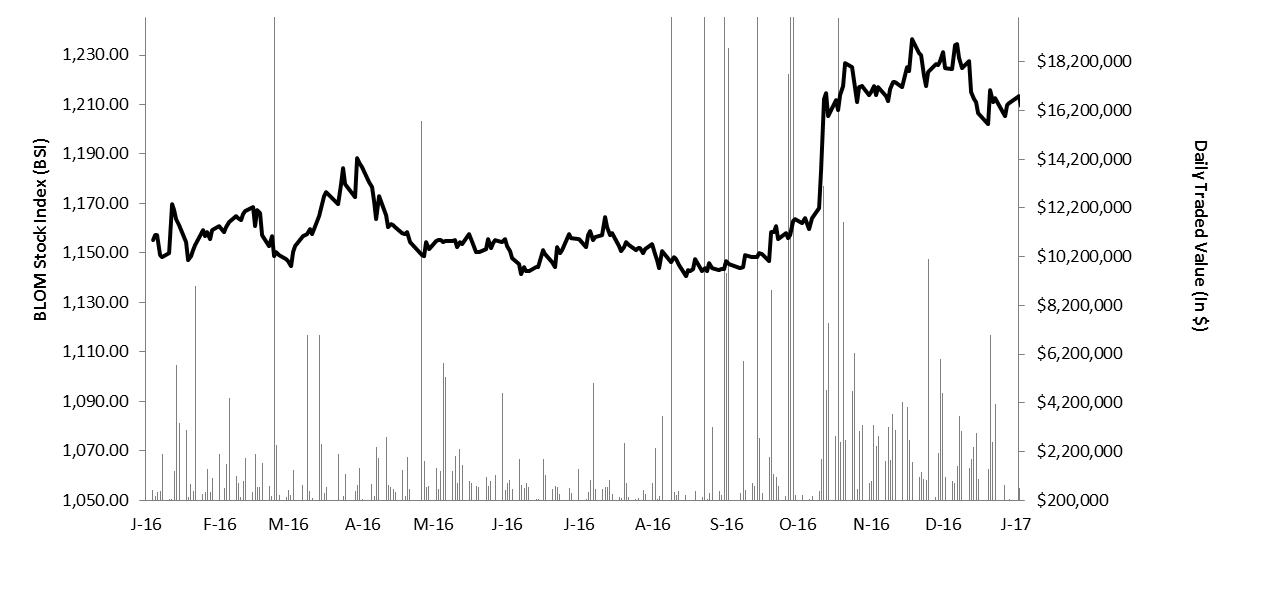
The BLOM Stock Index 52-WEEK TREND
Lebanese Global Depository Receipts: Last session’s Performance
| GDRs |
Last Price ($) |
Previous Price ($) |
% Change |
Volume |
Value ($) |
| BLOM GDR |
11.00 |
11.00 |
– |
– |
– |
| Audi GDR |
6.80 |
6.80 |
– |
– |
– |
| Byblos GDR |
79.00 |
79.00 |
– |
– |
– |
| Solidere GDR |
9.75 |
9.90 |
-1.52% |
5,049 |
49,228 |
Source: Reuters
Closing Date: 10 January 2017
BLOM BOND INDEX: Last Session’s Performance
| |
Last |
Previous |
Change |
Y-t-D Change |
| BBI |
103.40 |
103.09 |
0.30% |
|
1.47% |
| Weighted Yield |
6.34% |
6.40% |
-7 |
bps |
|
| Duration (Years) |
5.04 |
5.04 |
|
|
|
| 5Y Bond Yield |
6.32% |
6.37% |
-5 |
bps |
|
| 5Y Spread* |
443 |
448 |
-5 |
bps |
|
| 10Y Bond Yield |
6.87% |
6.93% |
-6 |
bps |
|
| 10Y Spread* |
449 |
455 |
-6 |
bps |
|
*between Lebanese Eurobonds and US Treasuries
Closing Date: 10 January 2017
Lebanese Eurobonds: Last Sessions’ Prices and Yields
| |
Price |
Yield |
Yield Change |
| 12/06/2018 |
99.90 |
5.22% |
-20 |
| 12/11/2018 |
99.88 |
5.22% |
-22 |
| 23/04/2019 |
99.63 |
5.67% |
0 |
| 20/05/2019 |
100.63 |
5.71% |
0 |
| 28/11/2019 |
99.13 |
5.78% |
0 |
| 09/03/2020 |
101.00 |
6.02% |
-5 |
| 14/04/2020 |
99.25 |
6.05% |
-4 |
| 19/06/2020 |
100.25 |
6.07% |
-5 |
| 12/04/2021 |
107.75 |
6.15% |
-7 |
| 04/10/2022 |
98.75 |
6.36% |
-11 |
| 27/01/2023 |
98.00 |
6.40% |
-10 |
| 22/04/2024 |
100.25 |
6.60% |
-9 |
| 04/11/2024 |
97.63 |
6.64% |
-8 |
| 03/12/2024 |
102.13 |
6.65% |
-10 |
| 26/02/2025 |
96.75 |
6.72% |
-4 |
| 12/06/2025 |
96.75 |
6.76% |
-4 |
| 28/11/2026 |
98.00 |
6.88% |
-7 |
| 29/11/2027 |
98.63 |
6.93% |
-5 |
| 03/11/2028 |
97.50 |
6.96% |
-5 |
| 26/02/2030 |
96.75 |
7.03% |
-3 |
| 22/04/2031 |
99.25 |
7.08% |
-3 |
| 02/11/2035 |
98.88 |
7.16% |
-4 |
| |
Last Price |
Previous |
% Change |
Y-t-D |
| $/LBP |
1,514.00 |
1,514.00 |
– |
|
| €/LBP |
1,583.93 |
1,598.25 |
-0.90% |
|
| £/LBP |
1,826.79 |
1,829.20 |
-0.13% |
|
| NEER |
119.25 |
118.31 |
0.14% |
0.46% |
Closing Date: 11 January 2017