Discover today’s performance of BLOM indices, the closing prices of Lebanese stocks and Eurobonds, as well as the exchange rate of major currencies against the LBP.
BLOM Stock Index (BSI) – Today’s performance
| |
Last |
Previous |
% Change |
Y-t-D Change |
| BSI |
596.91 |
596.84 |
0.01% |
-24.01% |
| High |
597.12 |
599.74 |
|
|
| Low |
595.72 |
594.87 |
|
|
| Volume |
26,355 |
28,375 |
|
|
| Val ($) |
236,445 |
255,229 |
|
|
I): BLOM preferred Shares Index (BPSI): today’s Performance
| |
Last |
Previous |
Change |
| BPSI |
66.67 |
66.67 |
0.00% |
| Volume |
– |
– |
|
| Value |
– |
– |
|
Lebanese Stocks: today’s Trades and Closing Prices
| |
Last Price ($) |
% Change |
Volume |
VWAP ($) |
| Solidere A |
9.03 |
0.22% |
24,352 |
9.03 |
| Solidere B |
9.00 |
-0.22% |
2,000 |
9 |
| BLOM Listed |
3 |
0.00% |
1 |
3 |
| BLOM GDR |
3.5 |
0.00% |
2 |
3.5 |
Closing Date: 24 March 2020
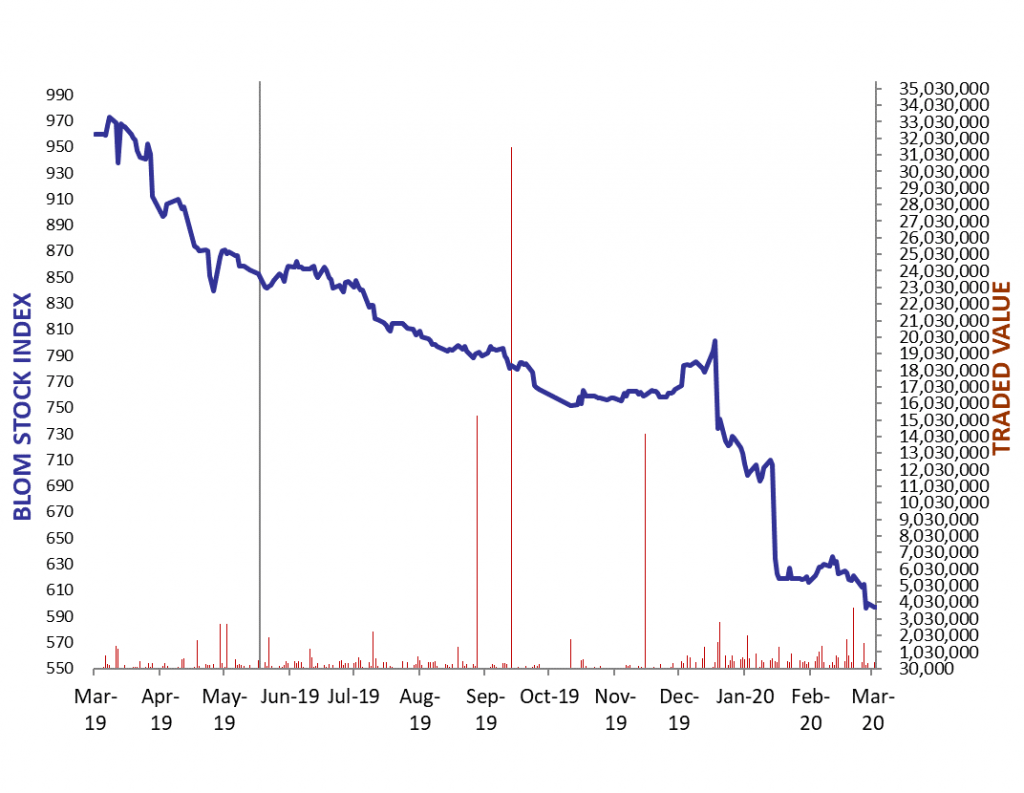
The BLOM Stock Index
Lebanese Global Depository Receipts: Last Session’s Performance
| GDRs |
Last Price ($) |
Previous Price ($) |
% Change |
Volume |
Value ($) |
| BLOM GDR |
1.70 |
1.70 |
0.00% |
47,270 |
80,359 |
| Audi GDR |
1.4 |
1.4 |
0.00% |
– |
– |
| Byblos GDR |
70 |
70 |
0.00% |
– |
– |
Closing Date: March 20th 2020
Source: London Stock Exchange
BLOM BOND INDEX: Last Session’s Performance
| |
Last |
Previous |
Change |
Y-t-D Change |
| BBI |
15.33 |
16.40 |
-6.54% |
|
-69.67% |
| Weighted Yield |
103.31% |
97.74% |
557 |
bps |
|
| Duration (Years) |
2.29 |
2.30 |
|
|
|
| 5Y Bond Yield |
114.40% |
110.00% |
440 |
bps |
|
| 5Y Spread* |
11,409 |
10,959 |
450 |
bps |
|
| 10Y Bond Yield |
56.60% |
53.40% |
320 |
bps |
|
| 10Y Spread* |
5,597 |
5,258 |
339 |
bps |
|
*between Lebanese Eurobonds and US Treasuries
Closing Date: 23 March 2020
Lebanese Eurobonds: Last Sessions’ Prices and Yields
|
Price |
Yield |
Yield Change |
| 12/04/2021 |
14.67 |
332.62% |
2,137 |
| 04/10/2022 |
13.63 |
121.18% |
155 |
| 27/01/2023 |
13.72 |
107.02% |
798 |
| 22/04/2024 |
13.92 |
80.76% |
789 |
| 04/11/2024 |
14.06 |
71.60% |
751 |
| 03/12/2024 |
15.19 |
70.18% |
(76) |
| 26/02/2025 |
14.03 |
68.38% |
16 |
| 12/06/2025 |
14.85 |
63.37% |
256 |
| 28/11/2026 |
13.81 |
59.25% |
340 |
| 23/03/2027 |
14.65 |
57.00% |
334 |
| 29/11/2027 |
13.78 |
56.47% |
280 |
| 03/11/2028 |
14.08 |
52.76% |
489 |
| 26/02/2030 |
14.00 |
50.85% |
18 |
| 22/04/2031 |
14.10 |
51.41% |
582 |
| 23/03/2032 |
14.06 |
51.12% |
549 |
| 02/11/2035 |
13.87 |
50.84% |
55 |
| 23/03/2037 |
13.93 |
52.15% |
49 |
Lebanese Forex Market
| |
Last Price |
Previous |
% Change |
Y-t-D |
| $/LBP |
1,514.25 |
1,514.25 |
– |
|
| €/LBP |
1,637.15 |
1,691.26 |
-3.20% |
|
| £/LBP |
1,769.05 |
1,917.99 |
-7.77% |
|
| NEER |
123.00 |
124.51 |
-1.22% |
|
Closing Date: 24 March 2020