Discover today’s performance of BLOM indices, the closing prices of Lebanese stocks and Eurobonds, as well as the exchange rate of major currencies against the LBP.
BLOM Stock Index (BSI) – today’s performance
| |
Last |
Previous |
% Change |
Y-t-D Change |
| BSI |
618.96 |
617.53 |
0.23% |
-21.21% |
| High |
618.96 |
618.93 |
|
|
| Low |
614.12 |
613.39 |
|
|
| Volume |
47,067 |
14,506 |
|
|
| Val ($) |
564,020 |
172,830 |
|
|
I): BLOM preferred Shares Index (BPSI): today’s Performance
| |
Last |
Previous |
Change |
| BPSI |
62.69 |
62.69 |
0.00% |
| Volume |
– |
– |
|
| Value |
– |
– |
|
Lebanese Stocks: today’s Trades and Closing Prices
| |
Last Price ($) |
% Change |
Volume |
VWAP ($) |
| Solidere A |
12.00 |
0.25% |
40,269 |
11.98 |
| Solidere B |
11.99 |
1.52% |
6,798 |
11.99 |
Closing Date: June 23rd 2020
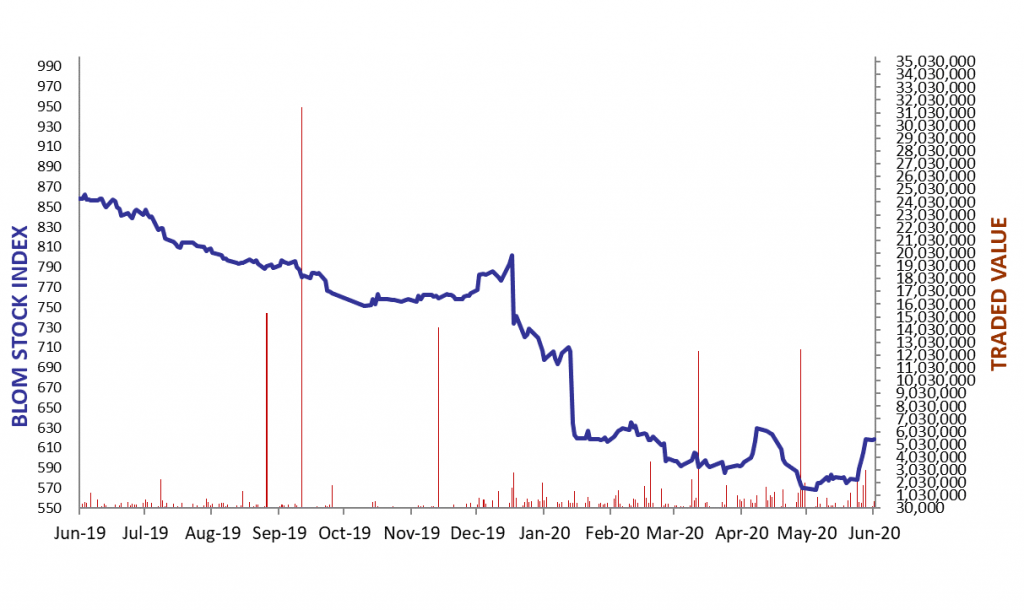
The BLOM Stock Index
Lebanese Global Depository Receipts: Last Session’s Performance
| Global Depository Receipts (GDRs) |
Last Price ($) |
Previous Price ($) |
% Change |
Volume |
Value ($) |
| BLOM GDR |
1.50 |
1.500 |
0.00% |
– |
– |
| Audi GDR |
0.43 |
0.43 |
0.00% |
3,802 |
1,635 |
| Byblos GDR |
70 |
70 |
0.00% |
– |
– |
Closing Date: June 18, 2020
Source: London Stock Exchange
BLOM BOND INDEX: Last Session’s Performance
| |
Last |
Previous |
Change |
Y-t-D Change |
| BBI |
17.22 |
17.62 |
-2.29% |
|
-65.94% |
| Weighted Yield |
59.43% |
58.42% |
101 |
bps |
|
| Duration (Years) |
2.92 |
2.97 |
|
|
|
| 5Y Bond Yield |
101.20% |
100.80% |
40 |
bps |
|
| 5Y Spread* |
10,101 |
10,061 |
40 |
bps |
|
| 10Y Bond Yield |
47.40% |
46.20% |
120 |
bps |
|
| 10Y Spread* |
4,706 |
4,587 |
119 |
bps |
|
*spread between Lebanese Eurobonds and US Treasuries
Closing Date: June 22nd 2020
Lebanese Eurobonds: Last Sessions’ Prices and Yields
|
Price |
Yield |
Yield Change |
| 10/4/2022 |
19.00 |
106.46% |
131 |
| 1/27/2023 |
18.25 |
96.51% |
187 |
| 4/22/2024 |
18.13 |
70.88% |
68 |
| 11/4/2024 |
18.08 |
62.99% |
140 |
| 12/3/2024 |
17.75 |
65.70% |
24 |
| 2/26/2025 |
18.30 |
59.19% |
56 |
| 6/12/2025 |
18.75 |
56.04% |
91 |
| 11/28/2026 |
18.30 |
49.56% |
48 |
| 3/23/2027 |
17.88 |
49.93% |
49 |
| 11/29/2027 |
17.92 |
47.23% |
117 |
| 11/3/2028 |
17.83 |
44.50% |
124 |
| 2/26/2030 |
17.88 |
41.98% |
44 |
| 4/22/2031 |
17.58 |
42.70% |
106 |
| 3/23/2032 |
17.83 |
41.38% |
133 |
| 11/2/2035 |
18.50 |
38.72% |
41 |
| 3/23/2037 |
18.13 |
40.21% |
156 |
Lebanese Forex Market
| |
Last Price |
Previous |
% Change |
Y-t-D |
| $/LBP |
1,514.25 |
1,514.25 |
– |
|
| €/LBP |
1,703.93 |
1,706.19 |
-0.13% |
|
| £/LBP |
1,878.65 |
1,905.48 |
-1.41% |
|
| NEER |
121.51 |
121.94 |
-0.36% |
|
Closing Date: June 23rd 2020