Lebanese Eurobonds Market Partly Recovered Monday’s Losses
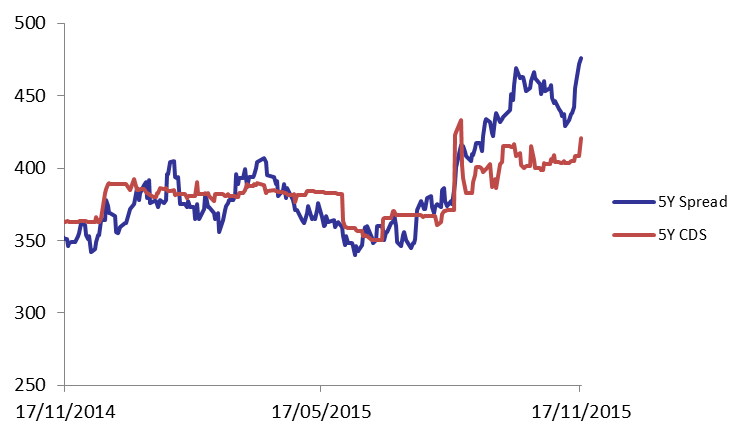
Demand for Lebanese Eurobonds slightly improved causing the BLOM Bond Index (BBI) to tick up by 0.02% to 102.94 points, narrowing its year-to-date loss to 4.22%. Yield on the 5Y Lebanese Eurobonds increased by 4 basis points (bps) to 6.42% while that of the 10Y went down by 1 bp to 6.87%. As demand for medium term maturities in the U.S. stagnated at Monday’s level of 1.66%, the spread between the yields of the 5Y Lebanese Eurobonds and their U.S. counterpart broadened by 4 bps to 476 bps. As for the Lebanese 5Y Credit Default Swaps (CDS), they broadened from their previous quotes of 392-417 bps to 408-433 bps.
| Last | Previous | Change | Y-t-D Change | ||
| BBI | 102.940 | 102.919 | 0.020% | -4.22% | |
| Weighted Yield | 6.32% | 6.32% | 0 | bps | |
| Duration (Years) | 5.14 | 5.14 | |||
| 5Y Bond Yield | 6.42% | 6.38% | 4 | bps | |
| 5Y Spread* | 476 | 472 | 4 | bps | |
| 10Y Bond Yield | 6.87% | 6.88% | -1 | bps | |
| 10Y Spread* | 462 | 461 | 1 | bps | |
*Between Lebanese and U.S notes
| Price | Yield | Yield Change (in bps) | |
| Nov. 2016 | 100 | 4.75% | 0 |
| Mar. 2017 | 105 | 5.09% | 9 |
| Oct. 2017 | 99.63 | 5.20% | -7 |
| Jun. 2018 | 99.38 | 5.41% | -5 |
| Nov. 2018 | 99 | 5.52% | 0 |
| Apr. 2019 | 99.5 | 5.66% | 0 |
| May. 2019 | 100.25 | 5.92% | 16 |
| Nov.2019 | 97.75 | 6.09% | 0 |
| Mar. 2020 | 100.5 | 6.24% | 13 |
| Apr. 2020 | 98.25 | 6.26% | 13 |
| Apr. 2021 | 107.5 | 6.58% | -5 |
| Oct. 2022 | 97.38 | 6.58% | -7 |
| Jan. 2023 | 96.63 | 6.59% | -9 |
| Nov. 2024 | 97.5 | 6.62% | -21 |
| Dec. 2024 | 102.5 | 6.63% | -20 |
| Feb. 2025 | 96 | 6.79% | -6 |
| Jun. 2025 | 96 | 6.83% | -4 |
| Nov. 2026 | 97.5 | 6.93% | 0 |
| Nov. 2027 | 97.88 | 7.01% | -2 |
| Nov. 2028 | 96.5 | 7.07% | 0 |
| Feb. 2030 | 95.25 | 7.19% | 6 |
| Nov. 2035 | 97.25 | 7.31% | 5 |