Lebanon’s Cumulative Trade Deficit Up by 8.14% YoY to $7.20B by May 2026
According to the Lebanese Customs Administration, Lebanon’s cumulative trade deficit increased by 8.14% year-over-year (YoY), to reach $7.20B by May 2026. This change was driven by a cumulative 3.78% YoY ($8,450 million) surge in imports by May 2026 and a 15.80% YoY ($1,247 million) fall in exports during the same period.
The widening of Lebanon’s trade deficit by May 2026 can be largely attributed to the repercussions of the renewed escalation of the Israel-Hezbollah conflict, which erupted in late February 2026 and continued to weigh on business activity, production, and trade flows throughout May despite the semi-ceasefire announced on April 17. Ongoing security uncertainty and repeated ceasefire breaches, particularly in southern Lebanon, continued to disrupt economic activity and hinder export-oriented sectors, contributing to the sharp decline in cumulative exports. Meanwhile, cumulative imports remained resilient, reflecting Lebanon’s continued reliance on imported goods to satisfy domestic demand and replace supplies disrupted by the conflict. Although monthly imports declined in May, cumulative import activity remained above the previous year’s level, ultimately contributing to the widening of Lebanon’s cumulative trade deficit.
Lebanon’s Balance of Trade (USD Million)

YTD: Year to Date
Top Import Destinations for Lebanon (YTD up to May 2026)
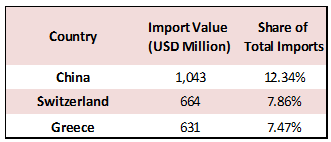
The top three import destinations by May 2026 were China, Switzerland, and Greece accounting for 12.34%, 7.86%, and 7.47% of the total value of imports, respectively. The top imported products were Mineral products (23.75%) at $2,007 million, Pearls, precious stones and metals (14.71%) at $1,243 million, and Products of the chemical or allied industries (9.61%) at $812 million.
Top Export Destinations for Lebanon (YTD up to May 2026)
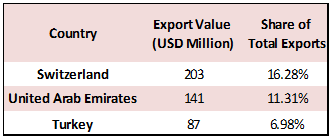
On the exports side, the top three destinations by May 2026 were Switzerland, United Arab Emirates, and Turkey capturing respective shares of 16.28%, 11.31% and 6.98% of the total value of exports. The top exported products were Pearls, precious stones and metals (28.15%) at $351 million, Base metals and articles of base metal (16.44%) at $205 million, and Prepared foodstuffs, beverages, tobacco (13.95%) at $174 million.