Mixed Demand for Lebanese Eurobonds on Tuesday
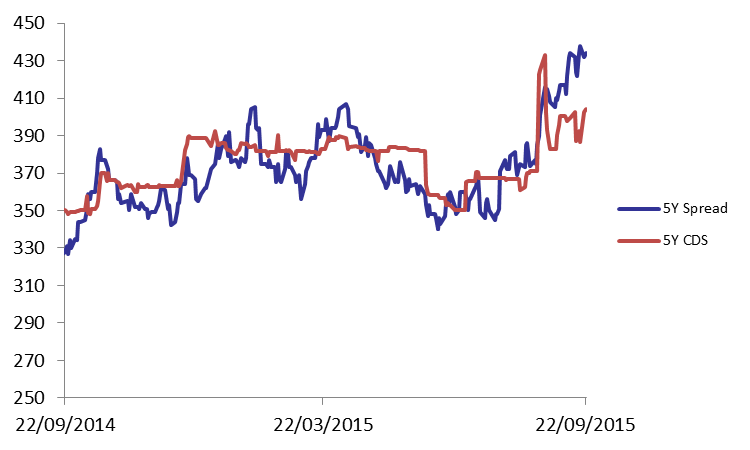
Even though demand for Lebanese Eurobonds progressed on Tuesday, the Lebanese Eurobonds market posted negative performance on weakening appetite for long-term notes. Accordingly, the BLOM Bond Index (BBI) declined yesterday by 0.02% to settle at 105.70 points, thus broadening its year-to-date loss to 1.65%. Yield on the 10Y Lebanese Eurobonds augmented by 1 basis point (bp) to 6.36% while that of the 5Y notes dropped by 5 bps to 5.78%. Demand for medium-term US notes strengthened on Tuesday, faster than that of its Lebanese counterpart, causing the spread between both maturities to widen by 2 bps to 434 bps. As for the Lebanese 5Y Credit Default Swaps (CDS), they stood at 393-415 bps compared to their previous quote of 390-415.
| Last | Previous | Change | Y-t-D Change | ||
| BBI | 105.696 | 105.722 | -0.02% | -1.65% | |
| Weighted Yield | 5.74% | 5.74% | 0 | bps | |
| Duration (Years) | 4.97 | 4.97 | |||
| 5Y Bond Yield | 5.78% | 5.83% | -5 | bps | |
| 5Y Spread* | 434 | 432 | 2 | bps | |
| 10Y Bond Yield | 6.36% | 6.35% | 1 | bps | |
| 10Y Spread* | 422 | 415 | 7 | bps | |
*Between Lebanese and U.S notes
| Price | Yield | Yield Change (in bps) | |
| Nov. 2016 | 100.58 | 4.21% | 0 |
| Mar. 2017 | 106.25 | 4.62% | -1 |
| Oct. 2017 | 100.38 | 4.80% | 0 |
| Jun. 2018 | 100.38 | 5.00% | 0 |
| Nov. 2018 | 100.13 | 5.10% | 0 |
| Apr. 2019 | 100.75 | 5.27% | 0 |
| May. 2019 | 102.25 | 5.31% | 0 |
| Nov.2019 | 99.88 | 5.48% | 3 |
| Mar. 2020 | 103.13 | 5.57% | 0 |
| Apr. 2020 | 100.75 | 5.61% | 0 |
| Apr. 2021 | 111 | 5.90% | -2 |
| Oct. 2022 | 100.38 | 6.03% | 2 |
| Jan. 2023 | 99.63 | 6.06% | 0 |
| Dec. 2024 | 105.25 | 6.24% | 0 |
| Feb. 2025 | 99.38 | 6.29% | 2 |
| Jun. 2025 | 99.38 | 6.33% | 2 |
| Nov. 2026 | 100.75 | 6.50% | 0 |
| Nov. 2027 | 101.5 | 6.57% | 0 |
| Feb. 2030 | 99.5 | 6.70% | 3 |