Relative Calmness on the Lebanese Eurobonds Front
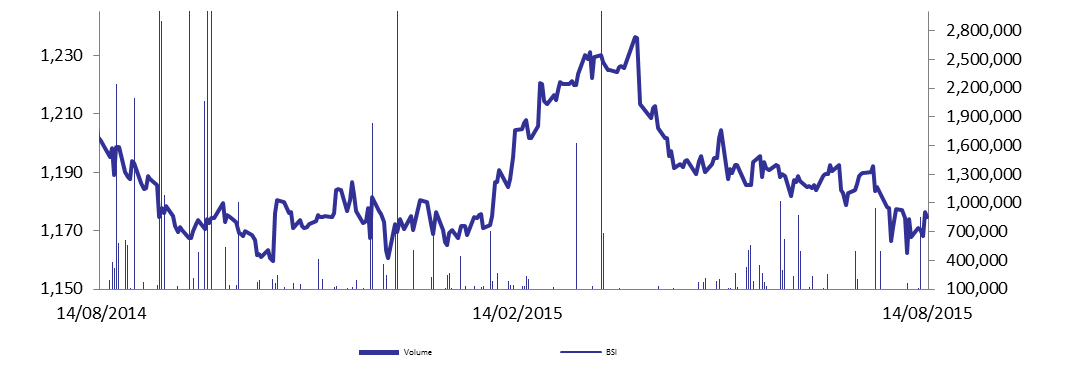
On the Lebanese Eurobonds market, demand for Lebanese Eurobonds was fairly calm, albeit an increase in demand was noticed over the short term bonds. This demand resulted in a slight increase of 0.003% in the BLOM Bond Index (BBI) that reached 107.21 points on Monday. The yields on the 5Y and 10Y Lebanese Eurobonds steadied at 5.35% and 6.20%, respectively. Meanwhile, demand for medium term US notes progressed illustrated by the 2 bps fall to 1.58% on the yield of the mentioned maturity. Consequently, the spread between Lebanese Eurobonds and their US counterpart broadened by 3 bps to 377 bps. The Lebanese 5Y Credit Default Swaps (CDS) remained at their previous quotes of 358-383 bps.
| 0 | Last | Previous | Change | Y-t-D Change | |
| BBI | 107.211 | 107.208 | 0.003% | -0.24% | |
| Weighted Yield | 5.46% | 5.46% | 0 | bps | |
| Duration (Years) | 5.04 | 5.05 | |||
| 5Y Bond Yield | 5.35% | 5.35% | 0 | bps | |
| 5Y Spread* | 377 | 374 | 3 | bps | |
| 10Y Bond Yield | 6.20% | 6.20% | 0 | bps | |
| 10Y Spread* | 404 | 400 | 4 | bps | |
*Between Lebanese and U.S notes
| Price | Yield | Yield Change (in bps) | |
| Nov. 2016 | 100.87 | 4.00% | 0 |
| Mar. 2017 | 107.21 | 4.26% | -2 |
| Oct. 2017 | 101.11 | 4.45% | 0 |
| Jun. 2018 | 101.43 | 4.60% | 0 |
| Nov. 2018 | 101.17 | 4.75% | 0 |
| Apr. 2019 | 101.38 | 5.08% | -4 |
| Mar. 2020 | 104 | 5.37% | 0 |
| Apr. 2020 | 101.63 | 5.40% | 0 |
| Apr. 2021 | 113 | 5.54% | 0 |
| Oct. 2022 | 101.88 | 5.77% | 0 |
| Jan. 2023 | 101 | 5.83% | 0 |
| Dec. 2024 | 107 | 6.00% | 0 |
| Feb. 2025 | 101.13 | 6.04% | 0 |
| Nov. 2026 | 103 | 6.22% | 0 |
| Nov. 2027 | 104 | 6.28% | 0 |
| Feb. 2030 | 102.25 | 6.41% | 0 |