Shy Activity on the Lebanese Eurobonds Market on Thursday
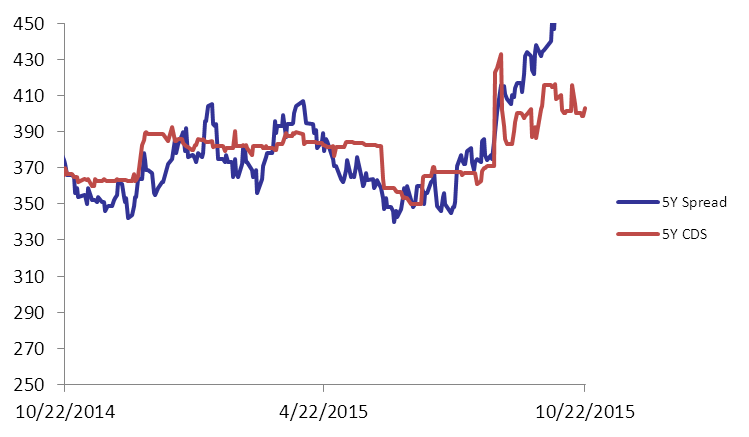
Demand for Lebanese Eurobonds remained relatively stable on Thursday, which caused the BLOM Bond Index (BBI) to barely tick up by 0.01% to 105.05 points, narrowing its year-to-date loss to 2.25%. Yields on the 5Y and 10Y Lebanese Eurobonds steadied at Wednesday’s level of 5.96% and 6.45%, respectively. In the US, demand for medium term maturities improved, causing the 5Y spread between the Lebanese Eurobonds and their U.S counterpart to broaden by 4 basis points (bps) to 460 bps. As for the Lebanese 5Y Credit Default Swaps (CDS), they expanded from their previous quotes of 387-410 bps to 392-415 bps.
| Last | Previous | Change | Y-t-D Change | ||
| BBI | 105.047 | 105.040 | 0.007% | -2.25% | |
| Weighted Yield | 5.90% | 5.90% | 0 | bps | |
| Duration (Years) | 4.92 | 4.92 | |||
| 5Y Bond Yield | 5.96% | 5.96% | 0 | bps | |
| 5Y Spread* | 460 | 456 | 4 | bps | |
| 10Y Bond Yield | 6.45% | 6.45% | 0 | bps | |
| 10Y Spread* | 441 | 437 | 4 | bps | |
*Between Lebanese and U.S notes
| Price | Yield | Yield Change (in bps) | |
| Nov. 2016 | 100.39 | 4.36% | 1 |
| Mar. 2017 | 105.5 | 4.91% | -1 |
| Oct. 2017 | 99.75 | 5.13% | 0 |
| Jun. 2018 | 99.75 | 5.25% | 0 |
| Nov. 2018 | 99.5 | 5.33% | 0 |
| Apr. 2019 | 100 | 5.50% | 0 |
| May. 2019 | 101.25 | 5.61% | 0 |
| Nov.2019 | 99 | 5.73% | 0 |
| Mar. 2020 | 102.25 | 5.78% | -3 |
| Apr. 2020 | 99.75 | 5.86% | 0 |
| Apr. 2021 | 110.25 | 6.02% | 0 |
| Oct. 2022 | 99.75 | 6.14% | 0 |
| Jan. 2023 | 99 | 6.17% | 0 |
| Dec. 2024 | 104.5 | 6.34% | 0 |
| Feb. 2025 | 98.88 | 6.36% | 0 |
| Jun. 2025 | 98.88 | 6.41% | 0 |
| Nov. 2026 | 100.5 | 6.53% | 0 |
| Nov. 2027 | 101.13 | 6.61% | 0 |
| Feb. 2030 | 99.25 | 6.73% | 0 |