Shy Trading Session on the Lebanese Eurobonds Market on Monday
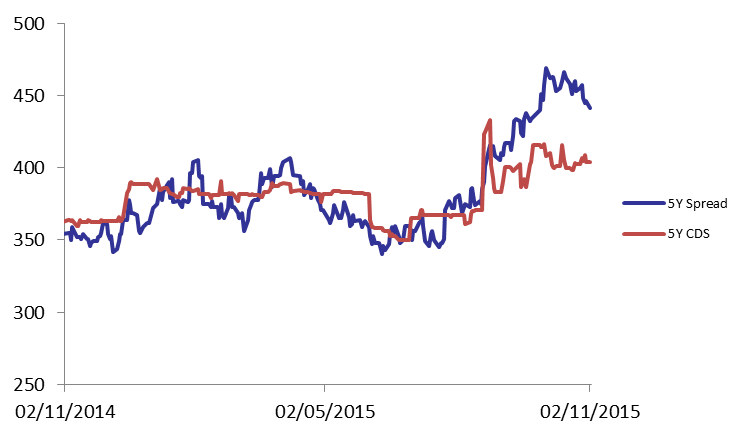
Demand for Lebanese Eurobonds stagnated during the first session of the week, which caused the BLOM Bond Index (BBI) to remain at 104.86 points, registering a year-to-date loss of 2.43%. Yields on the 5Y and 10Y Lebanese Eurobonds steadied at Friday’s levels of 5.98% and 6.45%, respectively, while demand for medium term maturities in the U.S. weakened. Accordingly, the 5Y spread between the Lebanese Eurobonds and their U.S counterpart narrowed by 5 basis points (bps) to 441 bps. As for the Lebanese 5Y Credit Default Swaps (CDS), they were unchanged, steadying at 392-416 bps.
| Last | Previous | Change | Y-t-D Change | ||
| BBI | 104.860 | 104.860 | 0.000% | -2.43% | |
| Weighted Yield | 5.93% | 5.93% | 0 | bps | |
| Duration (Years) | 4.89 | 4.90 | |||
| 5Y Bond Yield | 5.98% | 5.98% | 0 | bps | |
| 5Y Spread* | 441 | 446 | -5 | bps | |
| 10Y Bond Yield | 6.45% | 6.45% | 0 | bps | |
| 10Y Spread* | 425 | 429 | -4 | bps | |
*Between Lebanese and U.S notes
| Price | Yield | Yield Change (in bps) | |
| Nov. 2016 | 100.39 | 4.35% | 0 |
| Mar. 2017 | 105.38 | 4.92% | -2 |
| Oct. 2017 | 99.75 | 5.14% | 0 |
| Jun. 2018 | 99.75 | 5.25% | 0 |
| Nov. 2018 | 99.38 | 5.37% | 0 |
| Apr. 2019 | 100 | 5.50% | 0 |
| May. 2019 | 101.25 | 5.61% | 0 |
| Nov.2019 | 98.75 | 5.80% | 0 |
| Mar. 2020 | 102 | 5.85% | 0 |
| Apr. 2020 | 99.75 | 5.86% | 0 |
| Apr. 2021 | 110 | 6.06% | 0 |
| Oct. 2022 | 99.63 | 6.17% | 0 |
| Jan. 2023 | 98.88 | 6.19% | 0 |
| Dec. 2024 | 104.5 | 6.34% | 0 |
| Feb. 2025 | 98.88 | 6.36% | 0 |
| Jun. 2025 | 98.88 | 6.41% | 0 |
| Nov. 2026 | 100 | 6.60% | 0 |
| Nov. 2027 | 101 | 6.63% | 0 |
| Feb. 2030 | 98.63 | 6.80% | 0 |