Stagnant Demand for Lebanese Eurobonds on Monday
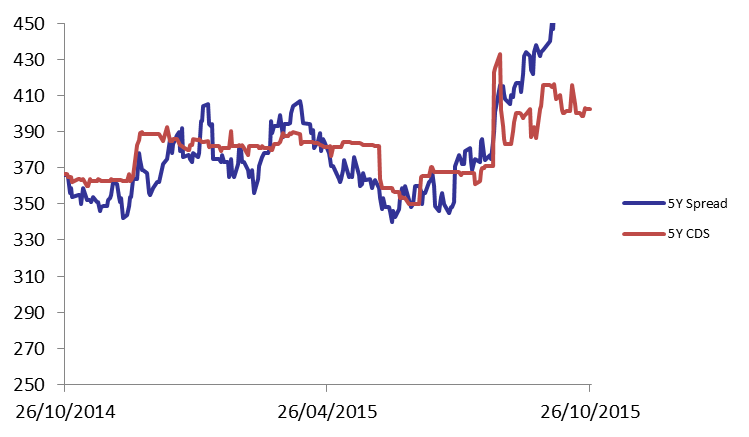
Demand for Lebanese Eurobonds stagnated during the first session of the week, which caused the BLOM Bond Index (BBI) to remain at 105.03 points, registering a year-to-date loss to 2.27%. Yields on the 5Y and 10Y Lebanese Eurobonds steadied at Friday’s level of 5.96% and 6.45%, respectively. In the US, demand for medium term maturities slightly progressed, causing the 5Y spread between the Lebanese Eurobonds and their U.S counterpart to broaden by 2 basis points (bps) to 455 bps. As for the Lebanese 5Y Credit Default Swaps (CDS), they steadied at their previous quotes of 391-414 bps.
| Last | Previous | Change | Y-t-D Change | ||
| BBI | 105.029 | 105.029 | 0.00% | -2.27% | |
| Weighted Yield | 5.90% | 5.90% | 0 | bps | |
| Duration (Years) | 4.91 | 4.92 | |||
| 5Y Bond Yield | 5.96% | 5.96% | 0 | bps | |
| 5Y Spread* | 455 | 453 | 2 | bps | |
| 10Y Bond Yield | 6.45% | 6.45% | 0 | bps | |
| 10Y Spread* | 438 | 436 | 2 | bps | |
*Between Lebanese and U.S notes
| Price | Yield | Yield Change (in bps) | |
| Nov. 2016 | 100.39 | 4.35% | 0 |
| Mar. 2017 | 105.5 | 4.88% | -2 |
| Oct. 2017 | 99.75 | 5.13% | 0 |
| Jun. 2018 | 99.75 | 5.25% | 0 |
| Nov. 2018 | 99.5 | 5.33% | 0 |
| Apr. 2019 | 100 | 5.50% | 0 |
| May. 2019 | 101.25 | 5.61% | 0 |
| Nov.2019 | 99 | 5.73% | 0 |
| Mar. 2020 | 102.25 | 5.78% | 0 |
| Apr. 2020 | 99.75 | 5.86% | 0 |
| Apr. 2021 | 110.25 | 6.02% | 0 |
| Oct. 2022 | 99.75 | 6.14% | 0 |
| Jan. 2023 | 99 | 6.17% | 0 |
| Dec. 2024 | 104.5 | 6.34% | 0 |
| Feb. 2025 | 98.88 | 6.36% | 0 |
| Jun. 2025 | 98.88 | 6.41% | 0 |
| Nov. 2026 | 100.38 | 6.55% | 0 |
| Nov. 2027 | 101.13 | 6.61% | 0 |
| Feb. 2030 | 99.13 | 6.74% | 0 |