Weak Demand on the Lebanese Eurobonds Market on Thursday
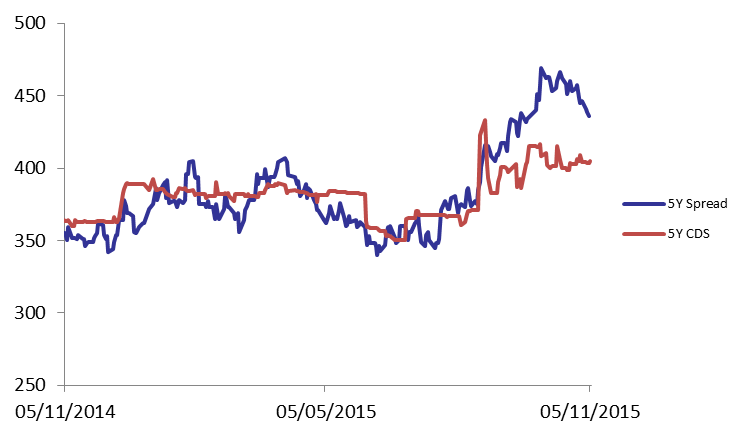
Appetite for Lebanese Eurobonds was lackluster Thursday illustrated by the numerous hikes on the yield. Accordingly, the BLOM Bond Index (BBI) declined by 0.08% to 104.70 points, broadening its year-to-date loss to 2.58%. Yields on the 5Y and 10Y Lebanese Eurobonds went up by 2 basis points (bps) and 3 bps to 6.02% and 6.51%, respectively. Similarly, demand for medium term maturities in the U.S. declined but at a slower pace than that of its Lebanese counterpart, causing the 5Y spread between both notes to broaden by 1 bp to 437 bps. As for the Lebanese 5Y Credit Default Swaps (CDS), they slightly widened from 391-416 bps to 392-417 bps.
| Last | Previous | Change | Y-t-D Change | ||
| BBI | 104.696 | 104.782 | -0.082% | -2.58% | |
| Weighted Yield | 5.96% | 5.94% | 2 | bps | |
| Duration (Years) | 4.88 | 4.88 | |||
| 5Y Bond Yield | 6.02% | 6.00% | 2 | bps | |
| 5Y Spread* | 437 | 436 | 1 | bps | |
| 10Y Bond Yield | 6.51% | 6.48% | 3 | bps | |
| 10Y Spread* | 425 | 423 | 2 | bps | |
*Between Lebanese and U.S notes
| Price | Yield | Yield Change (in bps) | |
| Nov. 2016 | 100.24 | 4.50% | 14 |
| Mar. 2017 | 105.25 | 4.99% | 9 |
| Oct. 2017 | 99.75 | 5.14% | 0 |
| Jun. 2018 | 99.75 | 5.25% | 0 |
| Nov. 2018 | 99.5 | 5.33% | 0 |
| Apr. 2019 | 100 | 5.50% | 0 |
| May. 2019 | 101 | 5.68% | 8 |
| Nov.2019 | 98.75 | 5.80% | 4 |
| Mar. 2020 | 102 | 5.84% | 3 |
| Apr. 2020 | 99.75 | 5.86% | 0 |
| Apr. 2021 | 109.5 | 6.17% | 5 |
| Oct. 2022 | 99.5 | 6.19% | 2 |
| Jan. 2023 | 98.63 | 6.24% | 0 |
| Dec. 2024 | 104.25 | 6.38% | 2 |
| Feb. 2025 | 98.5 | 6.41% | 2 |
| Jun. 2025 | 98.5 | 6.46% | 4 |
| Nov. 2026 | 99.88 | 6.61% | 0 |
| Nov. 2027 | 100.63 | 6.67% | 0 |
| Feb. 2030 | 98.5 | 6.81% | -1 |