Discover today’s performance of BLOM indices, the closing prices of Lebanese stocks and Eurobonds, as well as the exchange rate of major currencies against the LBP.
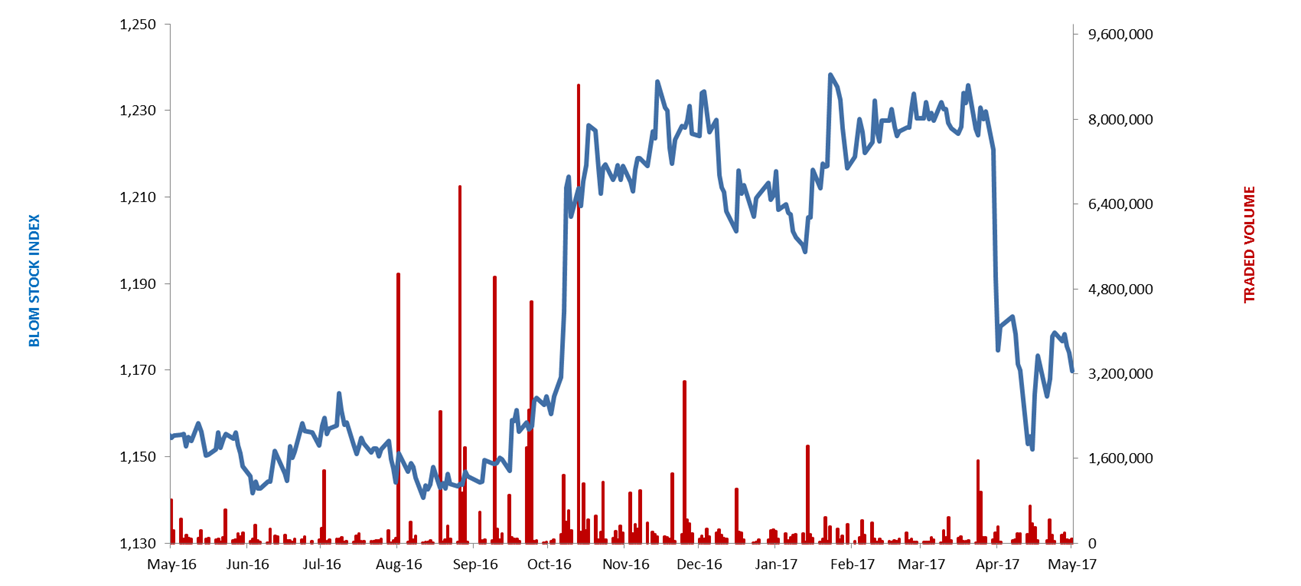
BLOM Stock Index (BSI): Today’s Performance
| Last | Previous | % Change | Y-t-D Change | |
| BSI | 1,163.62 | 1,169.71 | -0.52% | -4.05% |
| High | 1,169.71 | 1,174.05 | ||
| Low | 1,161.20 | 1,162.37 | ||
| Volume | 114,307 | 77,737 | 47.04% | |
| Val ($) | 1,059,471 | 734,361 | 44.27% |
BLOM Preferred Shares Index (BPSI): Today’s Performance
| Last | Previous | Change | |
| BPSI | 104.74 | 104.71 | 0.03% |
| Volume | 9,327 | 1,700 | |
| Value | 454,397 | 42,755 |
Lebanese Stocks: Today’s Trades and Closing Prices
| Last Price ($) | % Change | Volume | Value | VWAP ($) | |
| Solidere A | 8.69 | -3.44% | 12,231 | 106,599 | 8.72 |
| Solidere B | 8.50 | -3.41% | 249 | 2,118 | 8.50 |
| Bank Audi | 6.30 | -1.41% | 250 | 1,575 | 6.30 |
| Bank Audi GDR | 6.35 | – | 800 | 5,080 | 6.35 |
| Bank Audi Preferred G | 100.20 | – | 2,000 | 200,400 | 100.20 |
| Bank of Beirut Pref K | 25.15 | -0.40% | 6,400 | 160,960 | 25.15 |
| Byblos Bank | 1.66 | 2.47% | 55,910 | 92,954 | 1.66 |
| Byblos Bank Preferred 2008 | 100.90 | 0.40% | 438 | 44,188 | 100.90 |
| Byblos Bank Preferred 2009 | 101.00 | 0.10% | 489 | 49,389 | 101.10 |
| BLOM Bank Listed | 10.70 | – | 19,580 | 209,506 | 10.70 |
| BLOM GDR | 11.70 | – | 15,960 | 186,702 | 11.70 |
The BLOM Stock Index
Lebanese Global Depository Receipts: Last session’s Performance
| GDRs | Last Price ($) | Previous Price ($) | % Change | Volume | Value ($) |
| BLOM GDR | 11.70 | 11.65 | 0.43% | 12,000 | 140,400 |
| Audi GDR | 6.35 | 6.46 | -1.70% | 15,000 | 95,250 |
| Byblos GDR | 82.00 | 82.00 | – | – | – |
| Solidere GDR | 9.12 | 9.25 | -1.41% | 722 | 6,585 |
Source: Reuters
Closing Date: 12 May 2017
BLOM BOND INDEX: Last Session’s Performance
| Last | Previous | Change | Y-t-D Change | ||
| BBI | 106.42 | 106.42 | 0.00% | 4.44% | |
| Weighted Yield | 5.772% | 5.773% | -0.06 | bps | |
| Duration (Years) | 5.36 | 5.36 | |||
| 5Y Bond Yield | 5.49% | 5.49% | 0 | bps | |
| 5Y Spread* | 364 | 356 | 8 | bps | |
| 10Y Bond Yield | 6.53% | 6.53% | 0 | bps | |
| 10Y Spread* | 420 | 414 | 6 | bps | |
*between Lebanese Eurobonds and US Treasuries
Closing Date: 12 May 2017
Lebanese Eurobonds: Last Sessions’ Prices and Yields
| 12/06/2018 | 101.25 | 3.96% | 0 |
| 12/11/2018 | 101.50 | 4.11% | 0 |
| 23/04/2019 | 101.50 | 4.68% | 0 |
| 20/05/2019 | 102.50 | 4.69% | 0 |
| 28/11/2019 | 101.50 | 4.82% | 0 |
| 09/03/2020 | 103.50 | 5.03% | 0 |
| 14/04/2020 | 101.75 | 5.15% | 0 |
| 19/06/2020 | 102.75 | 5.18% | 0 |
| 12/04/2021 | 110.25 | 5.32% | 0 |
| 04/10/2022 | 102.50 | 5.56% | 0 |
| 27/01/2023 | 101.88 | 5.61% | 0 |
| 22/04/2024 | 103.25 | 6.07% | 0 |
| 04/11/2024 | 100.75 | 6.12% | 0 |
| 03/12/2024 | 105.00 | 6.16% | 0 |
| 26/02/2025 | 100.00 | 6.20% | 0 |
| 12/06/2025 | 100.00 | 6.25% | 0 |
| 28/11/2026 | 101.25 | 6.42% | 0 |
| 23/03/2027 | 102.38 | 6.52% | 0 |
| 29/11/2027 | 101.50 | 6.55% | 0 |
| 03/11/2028 | 100.38 | 6.60% | 0 |
| 26/02/2030 | 99.88 | 6.66% | 0 |
| 22/04/2031 | 101.25 | 6.86% | 0 |
| 23/03/2032 | 101.13 | 6.88% | 0 |
| 02/11/2035 | 100.25 | 7.03% | 0 |
| 23/03/2037 | 101.13 | 7.14% | 0 |
| Last Price | Previous | % Change | Y-t-D | |
| $/LBP | 1,514.25 | 1,514.25 | – | |
| €/LBP | 1,654.48 | 1,647.40 | 0.43% | |
| £/LBP | 1,947.69 | 1,941.36 | 0.33% | |
| NEER | 115.37 | 115.95 | -0.50% | -2.56% |
Closing Date: 15 May 2017