
Discover today’s performance of BLOM indices, the closing prices of Lebanese stocks and Eurobonds, as well as the exchange rate of major currencies against the LBP.
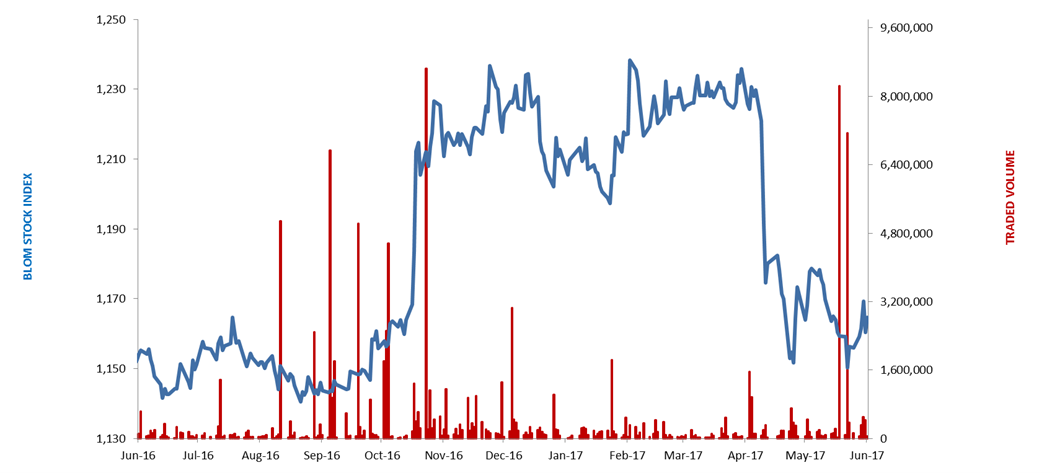
BLOM Stock Index (BSI): Today’s Performance
| Last | Previous | % Change | Y-t-D Change | |
| BSI | 1,173.60 | 1,166.34 | 0.62% | -3.23% |
| High | 1,175.21 | 1,167.65 | ||
| Low | 1,168.20 | 1,164.60 | ||
| Volume | 238,041 | 180,930 | 31.57% | |
| Val ($) | 3,450,257 | 1,379,670 | 150.08% |
BLOM Preferred Shares Index (BPSI): Today’s Performance
| Last | Previous | Change | |
| BPSI | 104.86 | 104.83 | 0.03% |
| Volume | 11,790 | 4,000 | |
| Value | 1,084,230 | 100,600 |
Lebanese Stocks: Today’s Trades and Closing Prices
| Last Price ($) | % Change | Volume | VWAP ($) | |
| Solidere A | 9.17 | 1.10% | 9,713 | 9.06 |
| Solidere B | 9.04 | 0.33% | 2,948 | 9.03 |
| Bank Audi | 6.20 | 0.49% | 4,240 | 6.20 |
| Bank Audi GDR | 6.25 | 0.81% | 1,200 | 6.25 |
| Bank Audi Preferred I | 101.00 | 0.30% | 9,390 | 101.00 |
| BoB Preferred Class H | 25.10 | -0.20% | 1,400 | 25.10 |
| Byblos Bank | 1.65 | 2.48% | 12,306 | 1.65 |
| Byblos Bank Prefered 2009 | 100.70 | – | 1,000 | 100.70 |
| Blom – Listed Shares | 10.95 | 0.46% | 136,467 | 10.95 |
| Blom GDR | 11.85 | 0.08% | 59,250 | 11.85 |
| HOLCIM | 11.90 | 2.32% | 127 | 11.90 |
The BLOM Stock Index
Lebanese Global Depository Receipts: Last session’s Performance
| GDRs | Last Price ($) | Previous Price ($) | % Change | Volume | Value ($) |
| BLOM GDR | 11.80 | 11.85 | -0.42% | 250 | 2,950 |
| Audi GDR | 6.12 | 6.12 | – | – | – |
| Byblos GDR | 82.00 | 82.00 | – | – | – |
| Solidere GDR | 8.81 | 8.76 | 0.57% | 99 | 872 |
Source: Reuters
Closing Date: 6 June 2017
BLOM BOND INDEX: Last Session’s Performance
| Last | Previous | Change | Y-t-D Change | ||
| BBI | 106.05 | 105.94 | 0.11% | 4.08% | |
| Weighted Yield | 5.893% | 5.919% | -2.60 | bps | |
| Duration (Years) | 5.33 | 5.33 | |||
| 5Y Bond Yield | 5.66% | 5.68% | -2 | bps | |
| 5Y Spread* | 395 | 394 | 1.5 | bps | |
| 10Y Bond Yield | 6.55% | 6.56% | -1 | bps | |
| 10Y Spread* | 441 | 438 | 3 | bps | |
*between Lebanese Eurobonds and US Treasuries
Closing Date: 5 June 2017
Lebanese Eurobonds: Last Sessions’ Prices and Yields
| Price | Yield | Yield Change | |
| 12/06/2018 | 100.75 | 4.39% | -13 |
| 12/11/2018 | 100.88 | 4.51% | -10 |
| 23/04/2019 | 101.15 | 4.85% | 0 |
| 20/05/2019 | 102.13 | 4.84% | -1 |
| 28/11/2019 | 101.00 | 5.02% | 0 |
| 09/03/2020 | 102.75 | 5.29% | -5 |
| 14/04/2020 | 101.15 | 5.36% | -1 |
| 19/06/2020 | 102.10 | 5.39% | -4 |
| 12/04/2021 | 109.38 | 5.51% | -4 |
| 04/10/2022 | 101.75 | 5.71% | 0 |
| 27/01/2023 | 100.75 | 5.84% | 0 |
| 22/04/2024 | 102.50 | 6.20% | -2 |
| 04/11/2024 | 100.00 | 6.25% | -2 |
| 03/12/2024 | 104.38 | 6.26% | -2 |
| 26/02/2025 | 99.63 | 6.26% | -2 |
| 12/06/2025 | 99.75 | 6.29% | -2 |
| 28/11/2026 | 101.38 | 6.40% | -2 |
| 23/03/2027 | 102.15 | 6.55% | 0 |
| 29/11/2027 | 101.50 | 6.55% | -5 |
| 03/11/2028 | 100.50 | 6.59% | -5 |
| 26/02/2030 | 99.88 | 6.66% | -4 |
| 22/04/2031 | 101.88 | 6.79% | -3 |
| 23/03/2032 | 101.63 | 6.82% | 0 |
| 02/11/2035 | 100.75 | 6.98% | -2 |
| 23/03/2037 | 101.75 | 7.08% | 0 |
| Last Price | Previous | % Change | Y-t-D | |
| $/LBP | 1,514.00 | 1,514.00 | – | |
| €/LBP | 1,692.17 | 1,689.76 | 0.14% | |
| £/LBP | 1,948.14 | 1,936.84 | 0.58% | |
| NEER | 113.98 | 113.96 | 0.02% | -3.74% |
Closing Date: 7 June 2017