
Discover today’s performance of BLOM indices, the closing prices of Lebanese stocks and Eurobonds, as well as the exchange rate of major currencies against the LBP.
BLOM Stock Index (BSI): Today’s Performance
| Last | Previous | % Change | Y-t-D Change | |
| BSI | 1,160.97 | 1,154.50 | 0.56% | -4.27% |
| High | 1,161.52 | 1,156.13 | ||
| Low | 1,159.00 | 1,152.41 | ||
| Volume | 257,045 | 658,016 | -60.94% | |
| Val ($) | 3,463,224 | 5,538,323 | -37.47% |
BLOM Preferred Shares Index (BPSI): Today’s Performance
| Last | Previous | Change | |
| BPSI | 105.03 | 105.09 | -0.06% |
| Volume | 2,850 | 1,100 | |
| Value | 2,826,789 | 110,120 |
Lebanese Stocks: Today’s Trades and Closing Prices
| Last Price ($) | % Change | Volume | VWAP ($) | |
| Solidere A | 8.19 | -0.49% | 27,404 | 8.19 |
| Solidere B | 8.06 | -0.12% | 542 | 8.06 |
| Bank Audi | 5.98 | 1.18% | 1,140 | 5.98 |
| Bank Audi GDR | 6.04 | 0.67% | 20,000 | 6.04 |
| Bank of Beirut Priority 2014 | 21 | – | 120,934 | 21 |
| Byblos Bank | 1.61 | 0.63% | 21,275 | 1.61 |
| Byblos Bank Preferred 2008 | 101.5 | -0.49% | 850 | 101.5 |
| Byblos Bank Preferred 2009 | 101.4 | 0.20% | 1,000 | 101.4 |
| BEMO- Listed Shares | 1.55 | -5.49% | 50,000 | 1.55 |
| BEMO Preferred 2013 | 99.5 | -0.50% | 1,000 | 99.5 |
| BLOM Listed shares | 11.5 | 0.88% | 2,900 | 11.5 |
| HOLCIM | 13.5 | 7.91% | 10,000 | 13.5 |
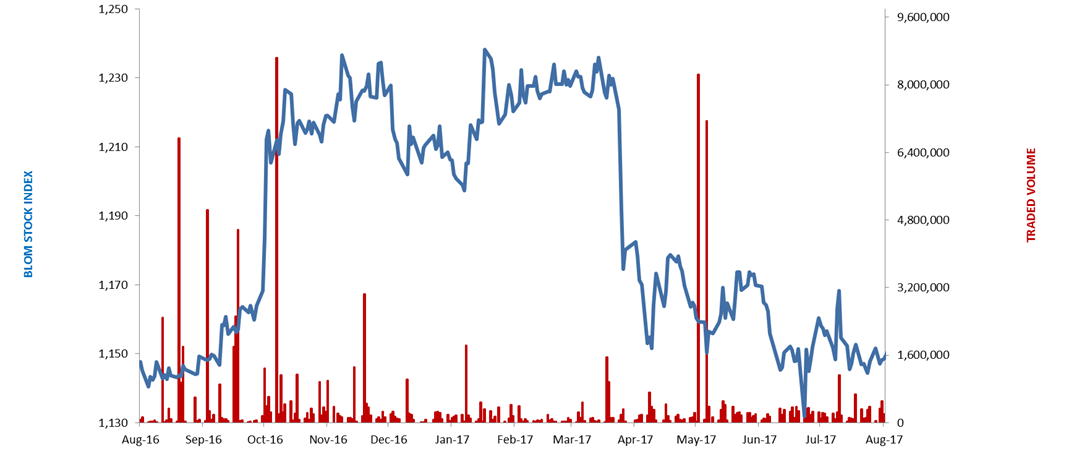
The BLOM Stock Index
Lebanese Global Depository Receipts: Last session’s Performance
| GDRs | Last Price ($) | Previous Price ($) | % Change | Volume | Value ($) |
| BLOM GDR | 12.6 | 12.5 | 0.8% | 82,929 | 1,044,905 |
| Audi GDR | 6 | 6 | 0.0% | – | – |
| Byblos GDR | 80 | 80 | 0.0% | – | – |
Source: London Stock Exchange
Closing Date: 29 Aug 2017
BLOM BOND INDEX: Last Session’s Performance
| Last | Previous | Change | Y-t-D Change | ||
| BBI | 104.15 | 104.15 | 0.00% | 2.21% | |
| Weighted Yield | 6.268% | 6.269% | 0 | bps | |
| Duration (Years) | 5.25 | 5.25 | |||
| 5Y Bond Yield | 6.28% | 6.28% | 0 | bps | |
| 5Y Spread* | 458 | 454 | 4 | bps | |
| 10Y Bond Yield | 6.87% | 6.87% | 0 | bps | |
| 10Y Spread* | 474 | 471 | 3 | bps | |
*between Lebanese Eurobonds and US Treasuries
Closing Date: 29 August 2017
Lebanese Eurobonds: Last Sessions’ Prices and Yields
| Price | Yield | Yield Change | |
| 12/11/2018 | 100.75 | 4.50% | 0 |
| 23/04/2019 | 100.50 | 5.18% | 0 |
| 20/05/2019 | 101.38 | 5.15% | 0 |
| 28/11/2019 | 100.50 | 5.21% | 0 |
| 09/03/2020 | 102.00 | 5.52% | 0 |
| 14/04/2020 | 100.38 | 5.64% | 0 |
| 19/06/2020 | 101.13 | 5.70% | 0 |
| 12/04/2021 | 107.13 | 6.03% | 0 |
| 04/10/2022 | 99.25 | 6.27% | 0 |
| 27/01/2023 | 98.50 | 6.33% | 0 |
| 22/04/2024 | 100.50 | 6.55% | 0 |
| 04/11/2024 | 98.25 | 6.56% | 0 |
| 03/12/2024 | 102.38 | 6.58% | 0 |
| 26/02/2025 | 97.88 | 6.56% | 0 |
| 12/06/2025 | 97.88 | 6.60% | 0 |
| 28/11/2026 | 99.13 | 6.73% | 0 |
| 23/03/2027 | 100.13 | 6.83% | 0 |
| 29/11/2027 | 99.00 | 6.89% | 0 |
| 03/11/2028 | 97.50 | 6.97% | 0 |
| 26/02/2030 | 97.13 | 7.00% | 0 |
| 22/04/2031 | 99.63 | 7.04% | 0 |
| 23/03/2032 | 99.13 | 7.10% | 0 |
| 02/11/2035 | 98.13 | 7.24% | 0 |
| 23/03/2037 | 99.00 | 7.35% | 0 |
| Last Price | Previous | % Change | Y-t-D | |
| $/LBP | 1,514.00 | 1,514.00 | – | |
| €/LBP | 1,795.88 | 1,804.78 | -0.49% | |
| £/LBP | 1,943.77 | 1,947.54 | -0.19% | |
| NEER | 110.96 | 110.38 | 0.53% | -6.29% |
Closing Date: 30 August 2017