
Discover today’s performance of BLOM indices, the closing prices of Lebanese stocks and Eurobonds, as well as the exchange rate of major currencies against the LBP.
BLOM Stock Index (BSI): Today’s Performance
| Last | Previous | % Change | Y-t-D Change | |
| BSI | 1,148.93 | 1,154.37 | -0.471% | -5.26% |
| High | 1,153.67 | 1,156.29 | ||
| Low | 1,148.93 | 1,154.06 | ||
| Volume | 43,612 | 73,328 | -40.52% | |
| Val ($) | 367,313 | 1,435,570 | -74.41% |
BLOM Preferred Shares Index (BPSI): Today’s Performance
| Last | Previous | Change | |
| BPSI | 105.17 | 105.17 | 0.00% |
| Volume | – | 7,276 | |
| Value | – | 739,161 |
Lebanese Stocks: Today’s Trades and Closing Prices
| Last Price ($) | % Change | Volume | VWAP ($) | |
| Solidere A | 7.92 | -1.12% | 11,731 | 7.95 |
| Solidere B | 7.92 | 1.93% | 700 | 7.92 |
| Bank Audi | 5.8 | -2.52% | 15,110 | 5.8 |
| Bank Audi GDR | 6 | 0.00% | 2,236 | 6 |
| BLOM – Listed | 11.6 | 0.00% | 7,250 | 11.6 |
| BLOM GDR | 12.65 | -0.39% | 6,585 | 12.65 |
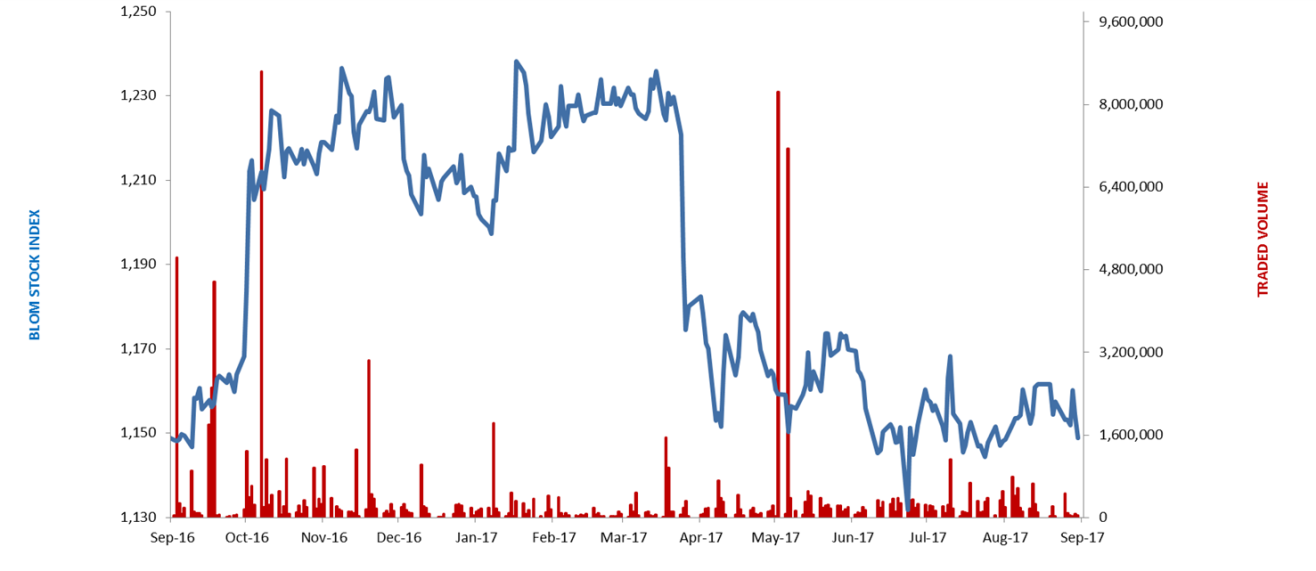
The BLOM Stock Index
Lebanese Global Depository Receipts: Last session’s Performance
| GDRs | Last Price ($) | Previous Price ($) | % Change | Volume | Value ($) |
| BLOM GDR | 12.65 | 12.60 | 0.4% | 30 | 380 |
| Audi GDR | 6 | 5.93 | 1.2% | 6,704 | 40,228 |
| Byblos GDR | 80 | 80 | 0.0% | – | – |
Source: London Stock Exchange
Closing Date: 15 Sept 2017
BLOM BOND INDEX: Last Session’s Performance
| Last | Previous | Change | Y-t-D Change | ||
| BBI | 104.52 | 104.42 | 0.10% | 2.57% | |
| Weighted Yield | 6.169% | 6.195% | -3 | bps | |
| Duration (Years) | 5.21 | 5.21 | |||
| 5Y Bond Yield | 6.18% | 6.23% | -5 | bps | |
| 5Y Spread* | 437 | 444 | -7 | bps | |
| 10Y Bond Yield | 6.77% | 6.79% | -2 | bps | |
| 10Y Spread* | 457 | 459 | -2 | bps | |
*between Lebanese Eurobonds and US Treasuries
Closing Date: 15 September 2017
Lebanese Eurobonds: Last Sessions’ Prices and Yields
| Price | Yield | Yield Change | |
| 12/11/2018 | 100.70 | 4.52% | 0 |
| 23/04/2019 | 100.95 | 4.87% | -5 |
| 20/05/2019 | 101.75 | 4.90% | -3 |
| 28/11/2019 | 100.85 | 5.03% | -5 |
| 09/03/2020 | 102.35 | 5.35% | -4 |
| 14/04/2020 | 100.75 | 5.48% | -5 |
| 19/06/2020 | 101.35 | 5.61% | -4 |
| 12/04/2021 | 107.88 | 5.78% | -4 |
| 04/10/2022 | 99.63 | 6.19% | -6 |
| 27/01/2023 | 99.00 | 6.22% | -3 |
| 22/04/2024 | 101.13 | 6.44% | -2 |
| 04/11/2024 | 98.75 | 6.47% | -2 |
| 03/12/2024 | 102.88 | 6.49% | -2 |
| 26/02/2025 | 98.00 | 6.54% | 0 |
| 12/06/2025 | 98.00 | 6.58% | -2 |
| 28/11/2026 | 99.38 | 6.69% | -2 |
| 23/03/2027 | 100.63 | 6.76% | -2 |
| 29/11/2027 | 99.75 | 6.78% | -2 |
| 03/11/2028 | 98.25 | 6.88% | -2 |
| 26/02/2030 | 97.50 | 6.95% | 0 |
| 22/04/2031 | 99.50 | 7.06% | -1 |
| 23/03/2032 | 99.00 | 7.11% | 0 |
| 02/11/2035 | 98.38 | 7.21% | -3 |
| 23/03/2037 | 98.75 | 7.37% | 1 |
| Last Price | Previous | % Change | Y-t-D | |
| $/LBP | 1,514.00 | 1,514.00 | – | |
| €/LBP | 1,802.37 | 1,800.41 | 0.11% | |
| £/LBP | 2,044.92 | 2,046.43 | -0.07% | |
| NEER | 110.58 | 110.52 | 0.05% | -6.61% |
Closing Date: 18 September 2017