Discover today’s performance of BLOM indices, the closing prices of Lebanese stocks and Eurobonds, as well as the exchange rate of major currencies against the LBP.
It is important to interpret the below indices within the most recent context, knowing that Lebanon witnessed a series of protests for 14 days (starting Oct. 17th 2019), which paralyzed the country.
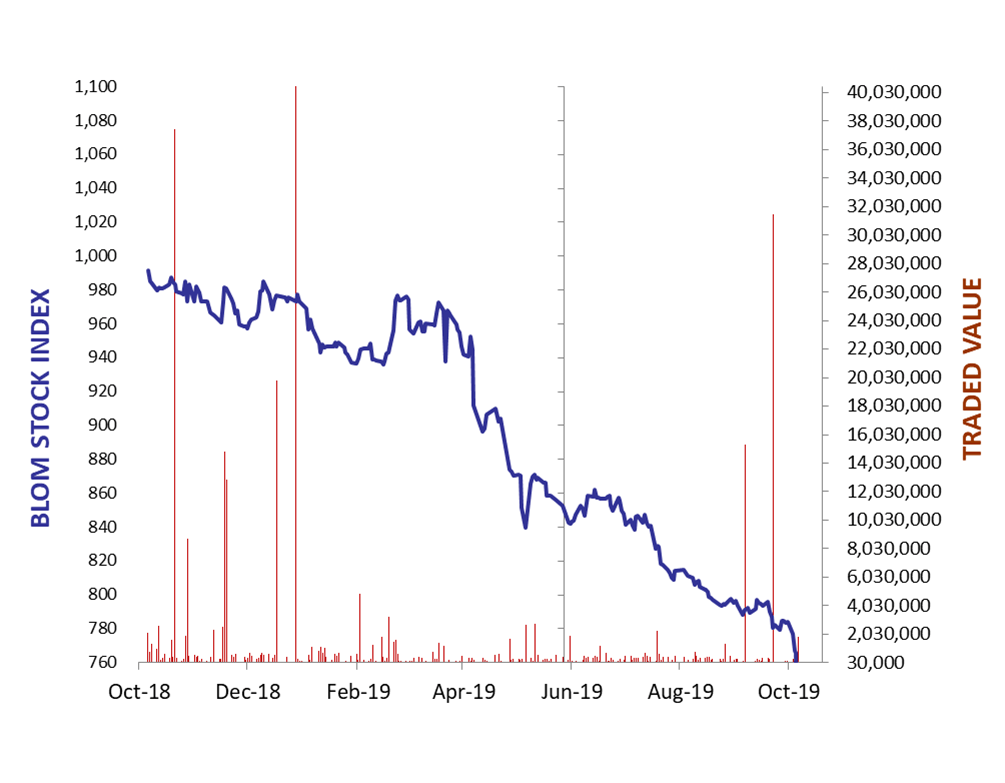
BLOM Stock Index (BSI) – today’s performance
| Last 01/11/2019 | Previous 17/10/2019 | % Change | Y-t-D Change | |
| BSI | 751.33 | 763.81 | -1.63% | -23.08% |
| High | 763.80 | 770.20 | ||
| Low | 751.00 | 762.20 | ` | |
| Volume | 14,906 | 498,181 | ||
| Val ($) | 72,623 | 1,826,406 |
I): BLOM preferred Shares Index (BPSI): today’s Performance
| Last | Previous | Change | |
| BPSI | 78.13 | 78.13 | 0.00% |
| Volume | – | 208 | |
| Value | – | 13,104 |
Lebanese Stocks: today’s Trades and Closing Prices
| Last Price ($) | % Change | Volume | VWAP ($) | |
| Solidere A | 4.75 | -12.84% | 14,849 | 4.87 |
| Solidere B | 4.75 | -12.41% | 59 | 4.75 |
The BLOM Stock Index
Lebanese Global Depository Receipts: Last session’s Performance
| GDRs | Last Price ($) | Previous Price ($) | % Change | Volume | Value ($) |
| BLOM GDR | 3.90 | 5.85 | -33.33% | 10,290 | 40,106 |
| Audi GDR | 3.08 | 3.08 | 0.00% | – | – |
| Byblos GDR | 70 | 70 | 0.00% | – | – |
Closing Date: 31 Oct. 2019
Source: London Stock Exchange
BLOM BOND INDEX: Last Session’s Performance
| Last 31/10/2019 | Previous 16/10/2019 | Change | Y-t-D Change | ||
| BBI* | 63.45 | 78.03 | -37.21% | ||
| Weighted Yield | 21.27% | 14.67% | 660 | bps | |
| Duration (Years) | 4.52 | 4.81 | |||
| 5Y Bond Yield | 25.50% | 17.50% | 800 | bps | |
| 5Y Spread* | 2,293 | 1,593 | 700 | bps | |
| 10Y Bond Yield | 17.18% | 13.42% | 376 | bps | |
| 10Y Spread* | 1,453 | 1,177 | 276 | bps | |
*between Lebanese Eurobonds and US Treasuries
Closing Date: 31 Oct. 2019
Lebanese Eurobonds: Last Sessions’ Prices and Yields
| Price | Yield | Yield Change | |
| 12/04/2021 | 69.68 | 37.16% | 1895 |
| 04/10/2022 | 60.30 | 26.41% | 881 |
| 27/01/2023 | 59.50 | 24.93% | 760 |
| 22/04/2024 | 57.30 | 22.17% | 617 |
| 04/11/2024 | 57.12 | 20.28% | 521 |
| 03/12/2024 | 56.75 | 21.33% | 520 |
| 26/02/2025 | 56.15 | 19.93% | 512 |
| 12/06/2025 | 56.88 | 19.09% | 482 |
| 28/11/2026 | 55.65 | 17.89% | 408 |
| 23/03/2027 | 55.70 | 17.87% | 392 |
| 29/11/2027 | 55.65 | 17.06% | 363 |
| 03/11/2028 | 55.50 | 16.21% | 352 |
| 26/02/2030 | 55.50 | 15.38% | 326 |
| 22/04/2031 | 55.74 | 15.30% | 306 |
| 23/03/2032 | 55.80 | 14.92% | 305 |
| 02/11/2035 | 55.80 | 14.06% | 278 |
| 23/03/2037 | 55.90 | 14.11% | 273 |
Lebanese Forex Market
| Last Price | Previous | % Change | Y-t-D | |
| $/LBP | 1,514.25 | 1,514.25 | – | |
| €/LBP | 1,681.62 | 1,681.16 | 0.03% | |
| £/LBP | 1,954.02 | 1,951.01 | 0.15% | |
| NEER | 118.05 | 118.63 | -0.49% |
Closing Date: 01- November. 2019