
Discover today’s performance of BLOM indices, the closing prices of Lebanese stocks and Eurobonds, as well as the exchange rate of major currencies against the LBP.
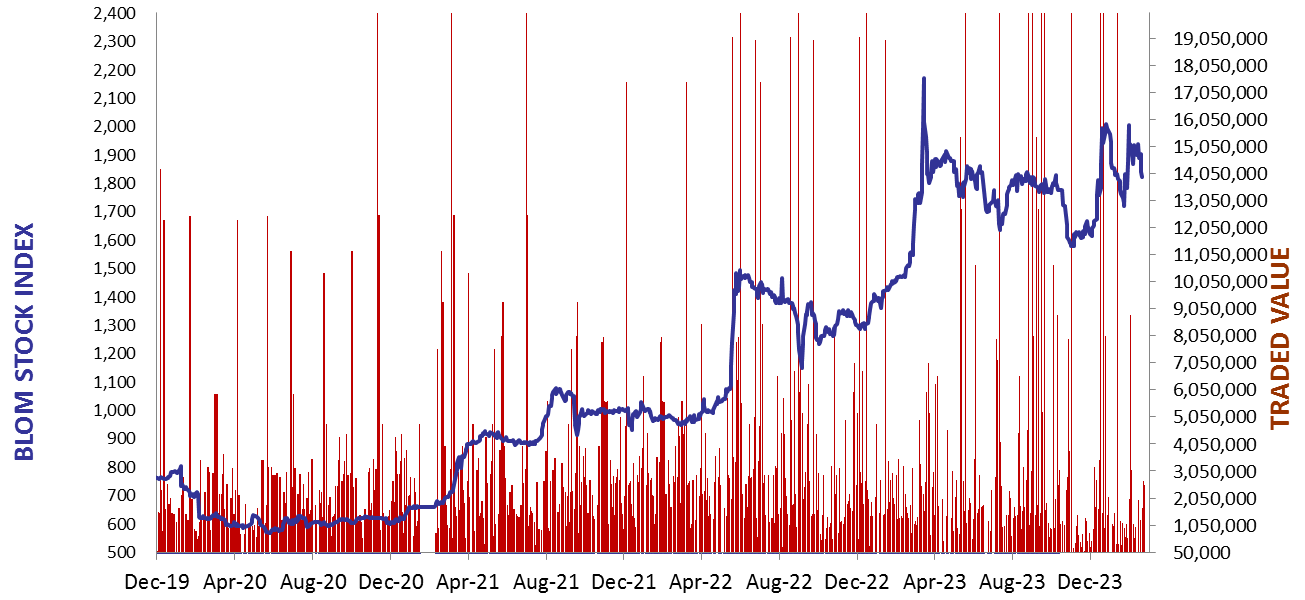
BLOM Stock Index (BSI) – today’s performance
| Last | Previous | % Change | Y-t-D Change | |
| BSI | 1,822.90 | 1,840.28 | -0.94% | -7.61% |
| High | 1,864.40 | 1,903.43 | ||
| Low | 1,808.46 | 1,810.23 | ||
| Volume | 46,608 | 33,152 | ||
| Val ($) | 2,536,892 | 2,661,123 |
I): BLOM preferred Shares Index (BPSI): today’s Performance
| Last | Previous | Change | |
| BPSI | 39.62 | 39.62 | 0.00% |
| Volume | |||
| Value |
Lebanese Stocks: today’s Trades and Closing Prices
| Last Price ($) | % Change | Volume | VWAP ($) | |
| Solidere A | 79.35 | -0.94% | 22,396 | 79.86 |
| Solidere B | 79.85 | -1.84% | 9,212 | 80.05 |
| Byblos Bank | 0.74 | -1.33% | 15,000 | 0.7 |
Closing Date: February 21, 2024
The BLOM Stock Index
BLOM BOND INDEX: Last Session’s Performance
| Last | Previous | Change | Y-t-D Change | ||
| BBI | 5.12 | 5.20 | -1.54% | -15.03% | |
| Weighted Yield | 212.70% | 210.35% | 235 | bps | |
| Duration (Years) | 1.13 | 1.15 | |||
| 5Y Bond Yield | 123.10% | 121.80% | 130 | bps | |
| 5Y Spread* | 11,813 | 11,682 | 131 | bps | |
| 10Y Bond Yield | 121.60% | 121.40% | 20 | bps | |
| 10Y Spread* | 11,722 | 11,697 | 25 | bps |
*spread between Lebanese Eurobonds and US Treasuries
| Price | Yield | Yield Change | |
| 26/02/2025 | 5.81 | 671.20% | (464) |
| 12/06/2025 | 5.94 | 429.38% | 145 |
| 28/11/2026 | 5.67 | 188.38% | 140 |
| 23/03/2027 | 5.68 | 175.60% | 302 |
| 29/11/2027 | 5.81 | 147.63% | 1 |
| 03/11/2028 | 5.65 | 131.86% | 13 |
| 26/02/2030 | 5.67 | 123.16% | 142 |
| 22/04/2031 | 5.68 | 121.42% | 25 |
| 23/03/2032 | 5.67 | 121.55% | 12 |
| 02/11/2035 | 5.83 | 117.03% | 20 |
| 23/03/2037 | 5.65 | 125.28% | 19 |
Closing Date: February 20, 2024
Lebanese Forex Market
| Last Price | Previous | % Change | |
| $/LBP | 15,000 | 15,000 | – |
| €/LBP | 16,215.00 | 16,212.00 | 0.02% |
| £/LBP | 18,939.00 | 18,934.50 | 0.02% |
| NEER | 239.09 | 239.07 | 0.01% |
Closing Date: February 21, 2024