Discover today’s performance of BLOM indices, the closing prices of Lebanese stocks and Eurobonds, as well as the exchange rate of major currencies against the LBP.
BLOM Stock Index (BSI) – today’s performance
| Last | Previous | % Change | Y-t-D Change | |
| BSI | 1,638.21 | 1,619.70 | 1.14% | -16.97% |
| High | 1,643.22 | 1,622.69 | ||
| Low | 1,619.70 | 1,611.92 | ||
| Volume | 4,970 | 15,975 | ||
| Val ($) | 345,940 | 1,113,638 |
I): BLOM preferred Shares Index (BPSI): today’s Performance
| Last | Previous | Change | |
| BPSI | 35.15 | 35.15 | 0.00% |
| Volume | |||
| Value |
Lebanese Stocks: today’s Trades and Closing Prices
| Last Price ($) | % Change | Volume | VWAP ($) | |
| Solidere A | 69.95 | -1.13% | 1,722 | 69.97 |
| Solidere B | 69.4 | 6.36% | 3,248 | 69.41 |
Closing Date: May 16, 2024
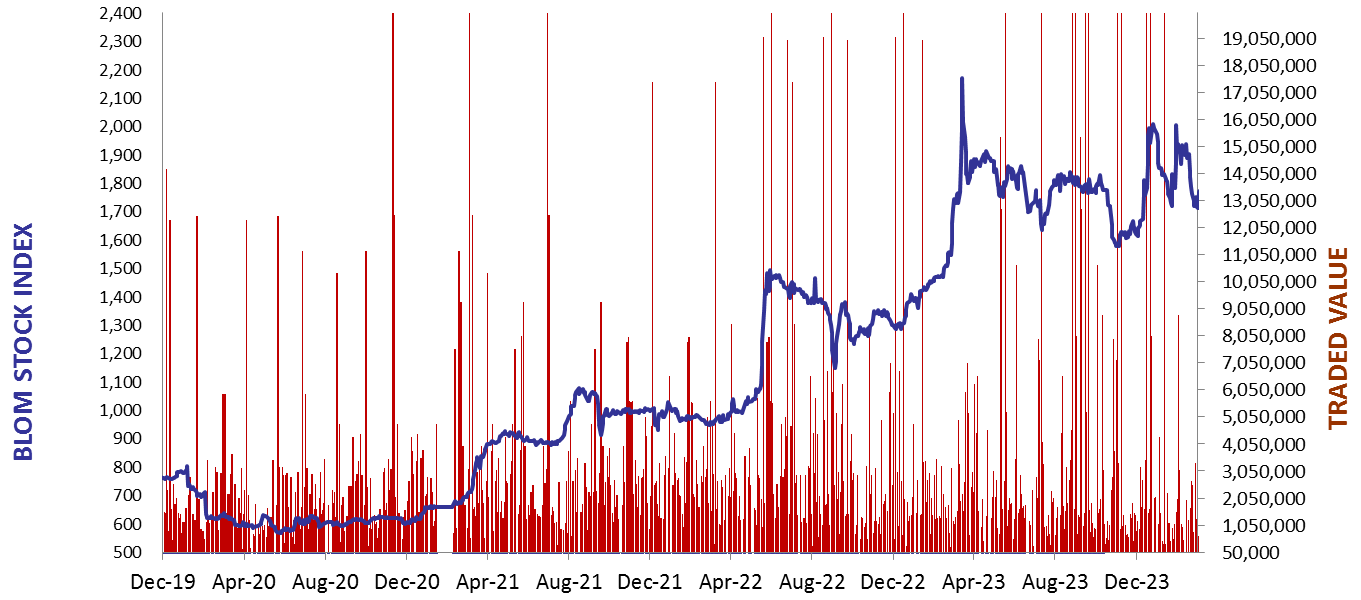
The BLOM Stock Index
BLOM BOND INDEX: Last Session’s Performance
| Last | Previous | Change | Y-t-D Change | ||
| BBI | 6.32 | 6.15 | 2.65% | 4.72% | |
| Weighted Yield | 226.25% | 229.26% | -301 | bps | |
| Duration (Years) | 1.37 | 1.35 | |||
| 5Y Bond Yield | 103.60% | 106.05% | -245 | bps | |
| 5Y Spread* | 9,850 | 10,089 | -239 | bps | |
| 10Y Bond Yield | 100.80% | 103.85% | -305 | bps | |
| 10Y Spread* | 9,629 | 9,923 | -294 | bps |
*spread between Lebanese Eurobonds and US Treasuries
| Price | Yield | Yield Change | |
| 26/02/2025 | 6.94 | 908.84% | (771) |
| 12/06/2025 | 7.11 | 524.31% | (435) |
| 28/11/2026 | 6.94 | 185.50% | (192) |
| 23/03/2027 | 7.00 | 165.56% | (283) |
| 29/11/2027 | 6.95 | 140.30% | (201) |
| 03/11/2028 | 6.99 | 119.12% | (242) |
| 26/02/2030 | 7.00 | 103.61% | (247) |
| 22/04/2031 | 6.97 | 103.58% | (233) |
| 23/03/2032 | 7.02 | 99.92% | (307) |
| 02/11/2035 | 7.00 | 100.19% | (309) |
| 23/03/2037 | 6.99 | 101.64% | (199) |
Closing Date: May 15, 2024
Lebanese Forex Market
| Last Price | Previous | % Change | |
| $/LBP | 89,500 | 89,500 | – |
| €/LBP | 97,340.20 | 97,393.90 | -0.06% |
| £/LBP | 113,441.25 | 113,530.75 | -0.08% |
| NEER | 227.02 | 227.21 | -0.08% |
Closing Date: May 16, 2024