
Discover today’s performance of BLOM indices, the closing prices of Lebanese stocks and Eurobonds, as well as the exchange rate of major currencies against the LBP.
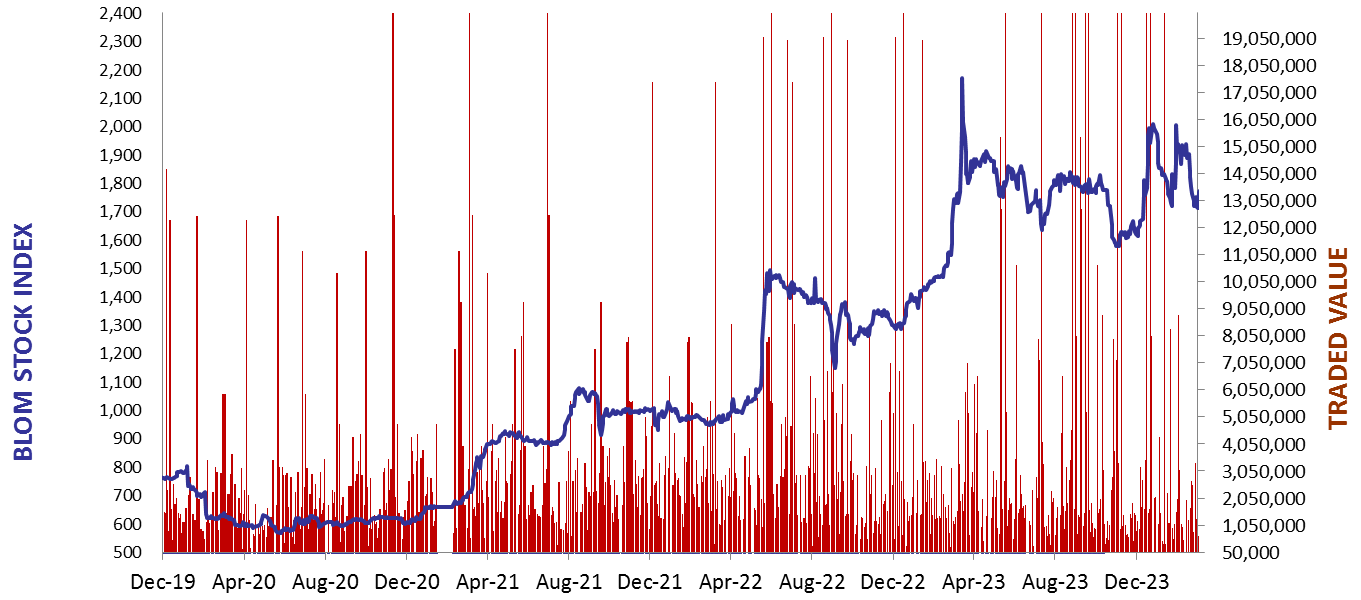
BLOM Stock Index (BSI) – today’s performance
| Last | Previous | % Change | Y-t-D Change | |
| BSI | 1,632.99 | 1,632.99 | 0.00% | -17.23% |
| High | 1,634.43 | 1,638.72 | ||
| Low | 1,629.97 | 1,624.56 | ||
| Volume | 11,167 | 32,890 | ||
| Val ($) | 318,667 | 484,153 |
I): BLOM preferred Shares Index (BPSI): today’s Performance
| Last | Previous | Change | |
| BPSI | 35.15 | 35.15 | 0.00% |
| Volume | |||
| Value |
Lebanese Stocks: today’s Trades and Closing Prices
| Last Price ($) | % Change | Volume | VWAP ($) | |
| Solidere A | 70 | 0.00% | 4,500 | 70 |
| Byblos Bank Listed Shares | 0.6 | 0.00% | 6,667 | 0.6 |
Closing Date: May 22, 2024
The BLOM Stock Index
BLOM BOND INDEX: Last Session’s Performance
| Last | Previous | Change | Y-t-D Change | ||
| BBI | 6.35 | 6.34 | 0.05% | 5.21% | |
| Weighted Yield | 229.81% | 229.13% | 68 | bps | |
| Duration (Years) | 1.36 | 1.36 | |||
| 5Y Bond Yield | 103.40% | 103.55% | -15 | bps | |
| 5Y Spread* | 9,826 | 9,840 | -14 | bps | |
| 10Y Bond Yield | 100.80% | 100.85% | -5 | bps | |
| 10Y Spread* | 9,619 | 9,623 | -4 | bps |
*spread between Lebanese Eurobonds and US Treasuries
| Price | Yield | Yield Change | |
| 26/02/2025 | 7.01 | 938.62% | 566 |
| 12/06/2025 | 7.15 | 538.00% | 224 |
| 28/11/2026 | 7.00 | 186.23% | 29 |
| 23/03/2027 | 7.00 | 166.16% | 11 |
| 29/11/2027 | 7.01 | 140.45% | 11 |
| 03/11/2028 | 7.03 | 118.71% | (25) |
| 26/02/2030 | 7.02 | 103.49% | (7) |
| 22/04/2031 | 7.00 | 103.00% | (3) |
| 23/03/2032 | 7.02 | 99.83% | (15) |
| 02/11/2035 | 7.00 | 99.93% | 14 |
| 23/03/2037 | 7.02 | 101.03% | 13 |
Closing Date: May 21, 2024
Lebanese Forex Market
| Last Price | Previous | % Change | |
| $/LBP | 89,500 | 89,500 | – |
| €/LBP | 97,161.20 | 97,143.30 | 0.02% |
| £/LBP | 113,772.40 | 113,727.65 | 0.04% |
| NEER | 226.96 | 227.06 | -0.04% |
Closing Date: May 22, 2024