
Discover today’s performance of BLOM indices, the closing prices of Lebanese stocks and Eurobonds, as well as the exchange rate of major currencies against the LBP.
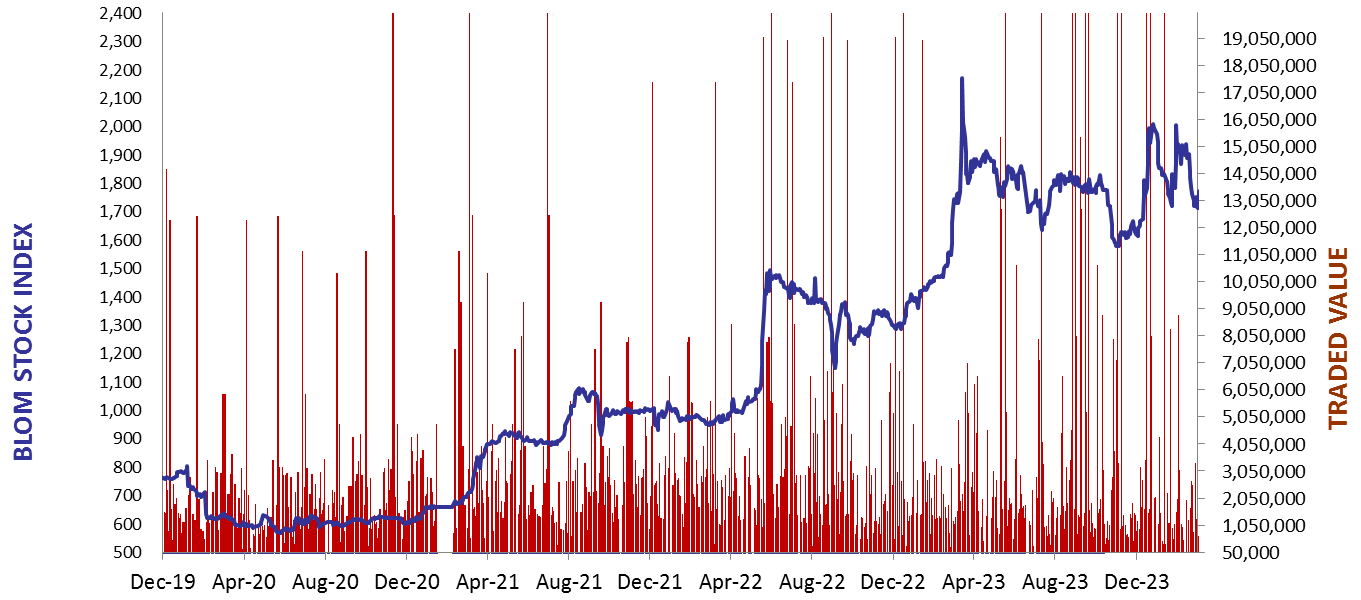
BLOM Stock Index (BSI) – today’s performance
| Last | Previous | % Change | Y-t-D Change | |
| BSI | 1,642.50 | 1,632.99 | 0.58% | -16.75% |
| High | 1,658.22 | 1,634.43 | ||
| Low | 1,632.99 | 1,629.97 | ||
| Volume | 41,838 | 11,167 | ||
| Val ($) | 2,928,031 | 318,667 |
I): BLOM preferred Shares Index (BPSI): today’s Performance
| Last | Previous | Change | |
| BPSI | 35.15 | 35.15 | 0.00% |
| Volume | |||
| Value |
Lebanese Stocks: today’s Trades and Closing Prices
| Last Price ($) | % Change | Volume | VWAP ($) | |
| Solidere A | 70 | 0.00% | 33,708 | 70 |
| Solidere B | 70 | 2.19% | 8,130 | 69.92 |
Closing Date: May 23, 2024
The BLOM Stock Index
BLOM BOND INDEX: Last Session’s Performance
| Last | Previous | Change | Y-t-D Change | ||
| BBI | 6.34 | 6.35 | -0.14% | 5.07% | |
| Weighted Yield | 230.75% | 229.81% | 94 | bps | |
| Duration (Years) | 1.35 | 1.36 | |||
| 5Y Bond Yield | 103.60% | 103.40% | 20 | bps | |
| 5Y Spread* | 9,844 | 9,826 | 18 | bps | |
| 10Y Bond Yield | 101.00% | 100.80% | 20 | bps | |
| 10Y Spread* | 9,636 | 9,619 | 17 | bps |
*spread between Lebanese Eurobonds and US Treasuries
| Price | Yield | Yield Change | |
| 26/02/2025 | 7.00 | 945.25% | 663 |
| 12/06/2025 | 7.16 | 540.67% | 267 |
| 28/11/2026 | 7.00 | 186.52% | 29 |
| 23/03/2027 | 7.00 | 166.27% | 11 |
| 29/11/2027 | 7.00 | 140.71% | 27 |
| 03/11/2028 | 7.00 | 119.05% | 34 |
| 26/02/2030 | 7.02 | 103.50% | 2 |
| 22/04/2031 | 6.94 | 103.70% | 71 |
| 23/03/2032 | 7.00 | 100.12% | 29 |
| 02/11/2035 | 7.01 | 99.79% | (14) |
| 23/03/2037 | 6.97 | 101.66% | 63 |
Closing Date: May 22, 2024
Lebanese Forex Market
| Last Price | Previous | % Change | |
| $/LBP | 89,500 | 89,500 | – |
| €/LBP | 96,892.70 | 96,847.95 | 0.05% |
| £/LBP | 113,897.70 | 113,799.25 | 0.09% |
| NEER | 227.09 | 226.96 | 0.06% |
Closing Date: May 23, 2024